Does the ICT reversal model actually have an edge?
A quantitative test of the sweep → displacement → market-structure-shift → fair-value-gap sequence on NQ futures — using a 16-year backtest log, one year of 1-minute bars, and 800 synthetic market-years.
Key findings
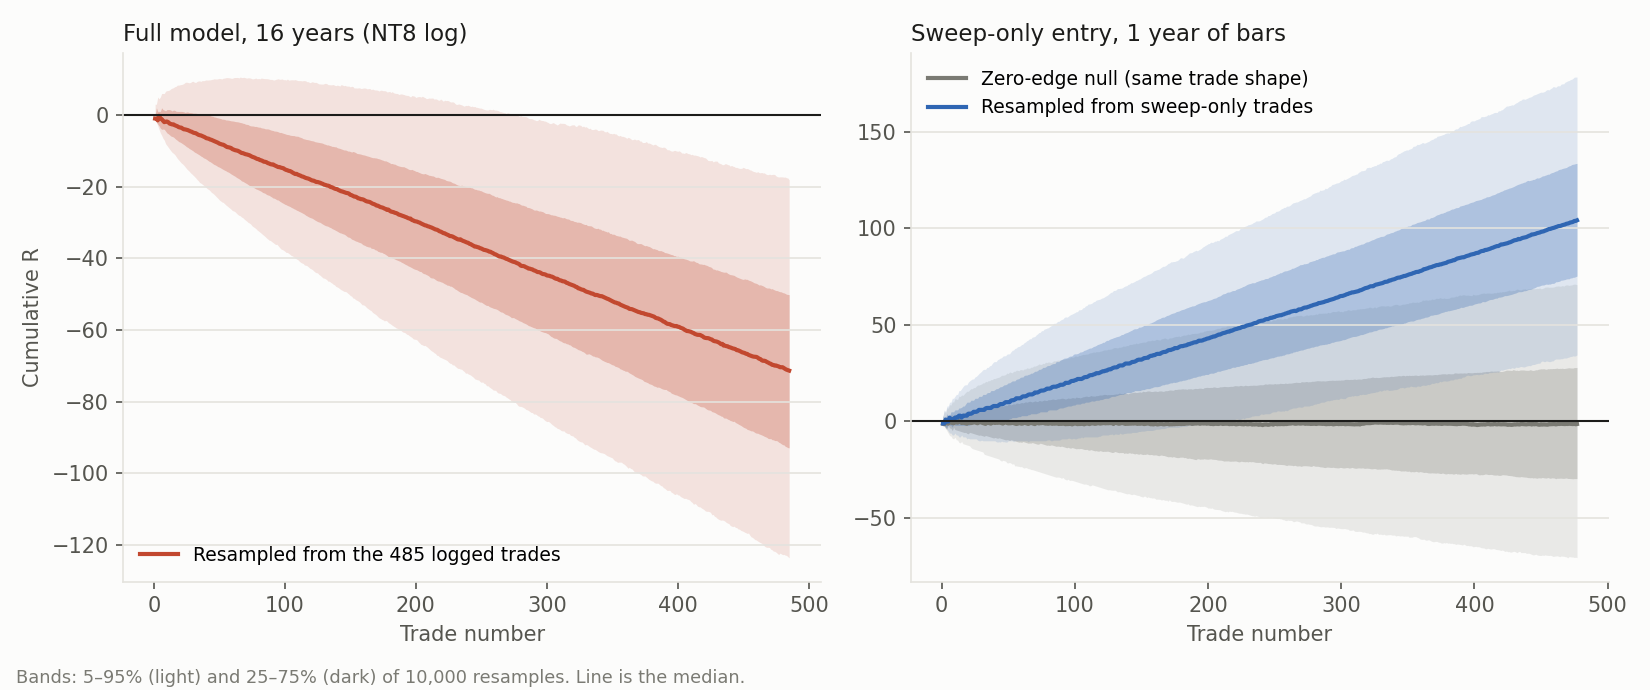
- Full model, 16-year log (485 trades): expectancy −0.147R per trade (95% interval −0.28R to −0.02R), profit factor 0.78, total −71R. The posterior probability of a positive edge is about 1%.
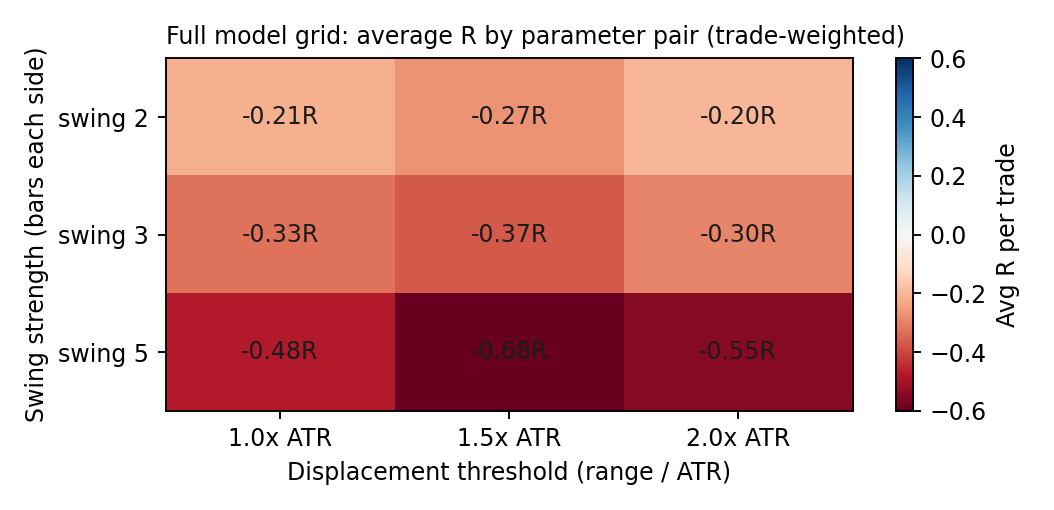
- Parameter search: across 1,728 combinations, the full sequence averaged −0.33R, and only 3.9% of runs were positive. The best 20 in-sample runs (+0.50R) flipped to −0.43R out-of-sample — textbook overfitting.
- The sweep is the only part with signal: a bare sweep of an external level was positive on the test year (+0.22R). Adding the MSS and FVG filters removed 97% of trades and turned the result negative.
- Market regimes: across 800 synthetic years, the sweep-only rule only made money in mean-reverting markets (median +52R) and lost in trending, crash, momentum and random-walk conditions.
- Prop-firm test: the full model passed a $9,000-target / $4,500-drawdown evaluation just 6.7% of the time — worse than a coin flip.
Verdict: under these definitions, the full ICT reversal model shows no positive edge — and probably a small negative one. This is exploratory evidence, not a proof; the open questions are listed at the end.
Smart Money Concepts and ICT are everywhere in retail trading. The "reversal model" — sweep a major level, wait for displacement, a market structure shift, and a fair value gap, then enter at the gap — is one of its most-taught setups. We wanted to know something simple: tested mechanically, over a long history, does it actually make money?
So we coded it as an explicit, rule-based strategy and ran it three ways: against a 16-year NinjaTrader 8 backtest log, against a year of 1-minute NQ bars with a full parameter search, and against 800 years of synthetic markets calibrated to real NQ volatility. Here's what we found.
1. The strategy we tested
Only the reversal model was coded. Every discretionary term was turned into an explicit, adjustable rule so the test is reproducible rather than a matter of interpretation:
- External levels: high/low of day (from midnight NY) and previous day high/low. A level must be at least 10 bars old to count.
- Sweep: a bar trades through the level by at least 1 tick and closes back inside. Each level can be swept once.
- Displacement: bar range ≥ 1.5 × ATR(14), body ≥ 60% of range, opposing wick ≤ 25%.
- Market structure shift (MSS): a close beyond the nearest pivot before the sweep extreme, within 15 bars — and the MSS bar must itself be a displacement bar.
- Fair value gap (FVG): a three-candle gap of at least 4 ticks within 3 bars of the MSS.
- Entry / stop / target: limit at the near FVG edge; stop at the sweep extreme + 2 ticks; fixed 3R target; session 09:30–14:00 NY, flat by 15:55.
The continuation model and the ES confluence filter were left out of this test. The strategy was written for NinjaTrader 8 and ported to Python for the grid, Monte Carlo and regime work.
2. The data
| Dataset | Coverage | Used for |
|---|---|---|
| NT8 strategy log | Jan 2010 – Sep 2026 · 7,781 setups, 485 trades | Full-model stats, Monte Carlo, prop-firm test |
| NQ 1-minute bars | Sep 2025 – Sep 2026 · regular hours | Python port, grid search, stage tests |
| Synthetic bars | 8 regimes × 100 years | Regime stress tests, Monte Carlo |
One honesty note up front: the bar file has no overnight data, and the NT8 database prices differ in scale from the bar file, so the Python port could not be reconciled trade-for-trade against the log. R-multiples are unaffected by that scale difference, but point-based risk filters are. This, and the other caveats, are why we call this exploratory.
3. The full model over 16 years
Of 7,781 setups, only 485 became trades — 91% died before an order was placed. The ones that made it through:
The payoff ratio was actually healthy — average win +2.62R against average loss −0.93R, a 2.83 ratio. The problem was the win rate: 19.6% against a break-even of 26.1%. The target was hit on just 15.7% of trades (a binomial test against 25% gives p ≈ 4×10⁻⁷). The implied Kelly fraction is −8.8% — negative, meaning the optimal bet size is zero.
No slice rescued it. By level: previous-day-high was least bad (−0.04R), previous-day-low worst (−0.27R). Shorts (−0.09R) beat longs (−0.23R). Only 4 of 17 calendar years were positive, none by more than 0.3R per trade. Where setups died: 64% never got an MSS in time, 21% broke without displacement, 3% lacked an FVG.
4. Parameter search & overfitting
We ran the full sequence across 1,728 parameter combinations — swing strength, displacement threshold, sweep-to-MSS window, FVG rules, maximum risk, and more. The trade-weighted average of every run was −0.33R. Only 3.9% of runs with 10+ trades were positive, and the single best was +0.13R on just 15 trades.
The tell-tale overfitting signal: the top 20 runs on the first six months averaged +0.50R there, then −0.43R on the last six months. Settings that looked great in-sample had no predictive power out-of-sample.
5. Which component actually adds the edge?
We rebuilt the model one filter at a time to see where the signal was — and where it drained away:
| Stage | Trades | Avg R | 95% interval |
|---|---|---|---|
| A. Sweep only | 477 | +0.22 | +0.05 to +0.40 |
| B. + Displacement | 111 | +0.22 | −0.16 to +0.59 |
| C. + Market structure shift | 16 | −0.63 | −1.12 to −0.13 |
| D. + FVG entry | 14 | −0.32 | −1.07 to +0.43 |
This is the heart of it. A bare sweep of an external level was positive (+0.22R) and beat both a random-entry control and a control using sweeps of internal levels — so the external level does seem to matter. But each ICT filter you stack on top removes trades and adds nothing. Adding MSS and FVG stripped out 97% of the trades and pushed the result negative.
Even the sweep-only result isn't something to trade yet: it's +0.37R in the first half of the year and +0.06R in the second, and at a 1R target it's essentially zero — the edge comes entirely from a few winners running to 2–3R. With realistic costs it falls to about +0.10–0.15R.
6. Monte Carlo & market regimes
Resampling the strategy's own trades 10,000 times, a year of +120R never once appeared for the full model — at ~29 trades a year, even a 100% win rate caps out near 87R. The full model finished positive in only 1.6% of 16-year simulations.
Then we generated eight regimes of synthetic NQ-like prices — random walk, bull and bear trends, range/mean-reverting, high-vol chop, crash, momentum breakout, low-vol grind — and ran 100 simulated years of each. The sweep-only rule only made money in one regime:
| Regime | Sweep-only median R | Profit in |
|---|---|---|
| Random walk (control) | −54 | 10% |
| Bull trend | −58 | 7% |
| Bear trend | −65 | 6% |
| Range / mean-reverting | +52 | 87% |
| High-vol chop | +6 | 60% |
| Crash / panic | −67 | 6% |
| Momentum breakout | −66 | 4% |
| Low-vol grind | −41 | 9% |
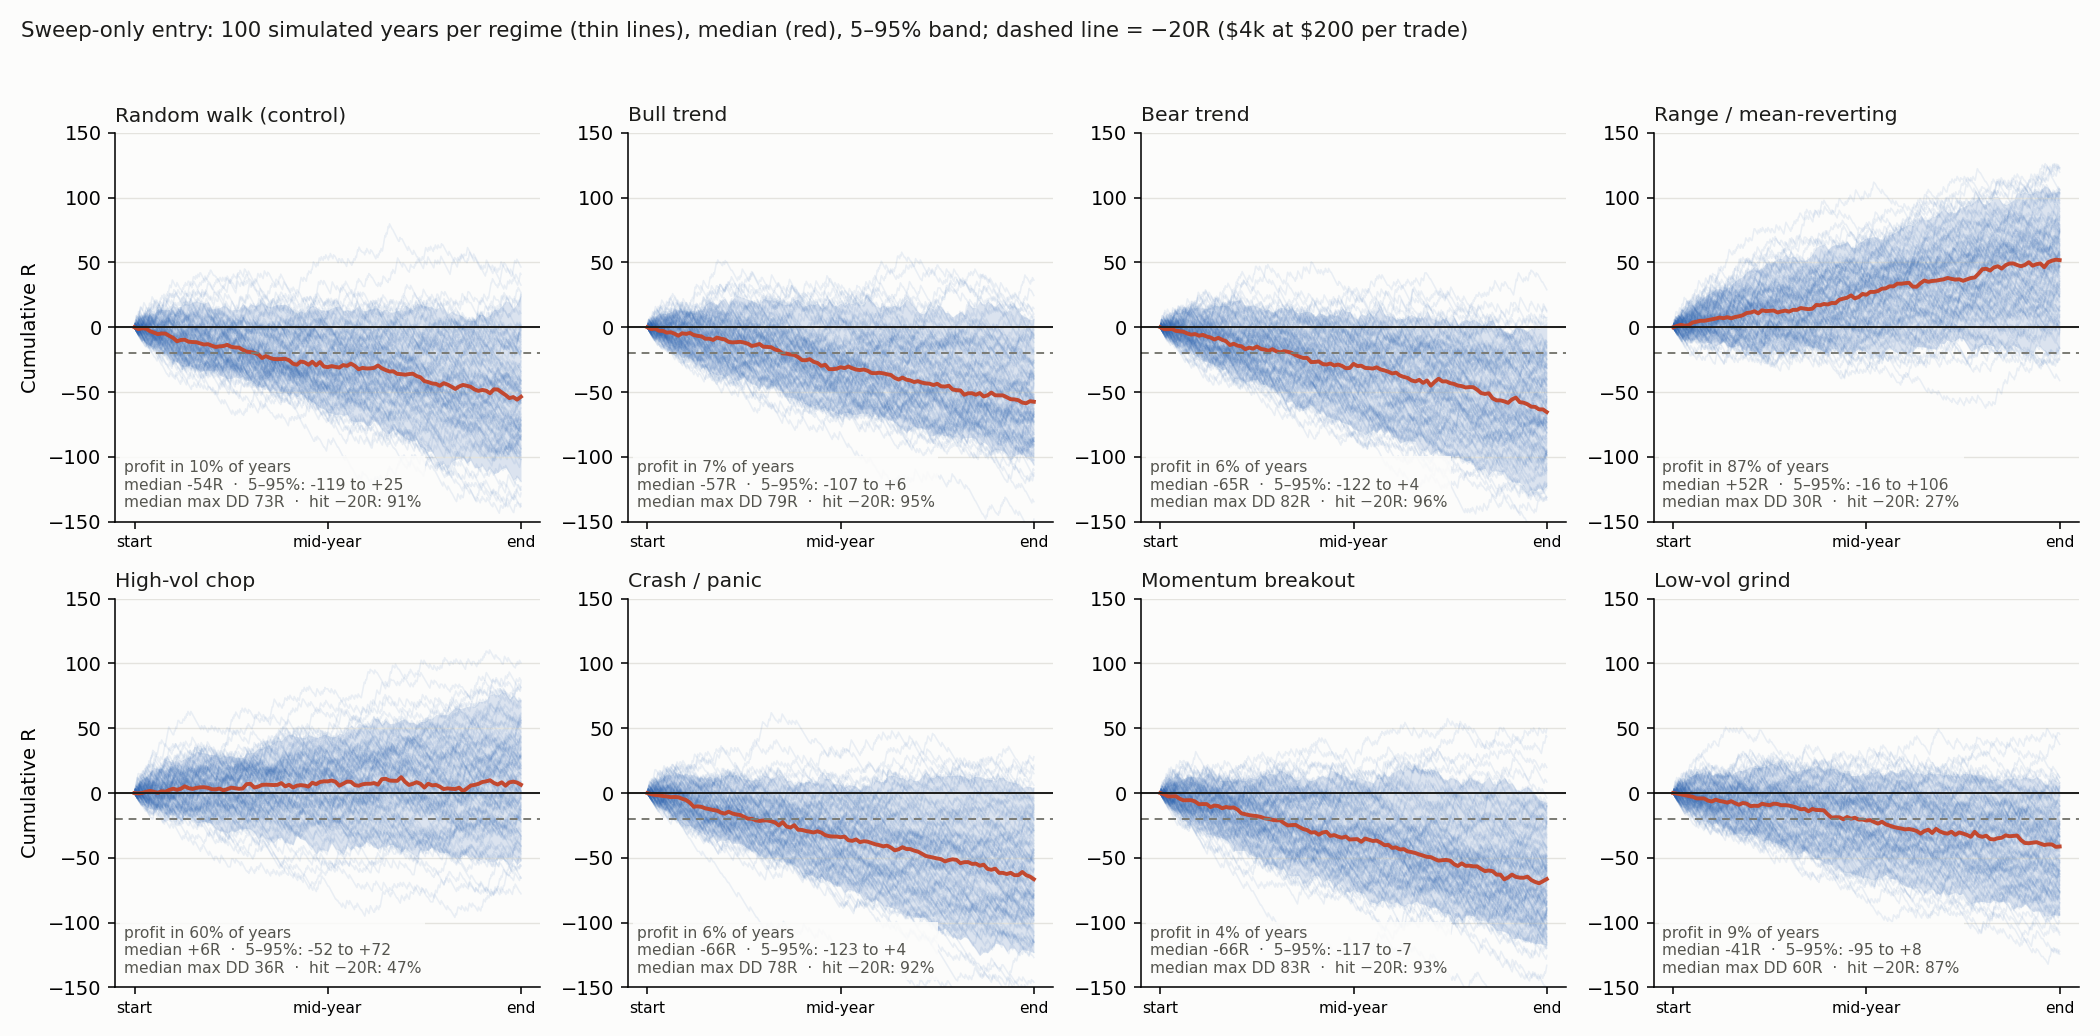
The takeaway: a tight-stop, 3R-target rule bleeds about 0.10R per trade on a pure random walk, and only turns a profit when the market reverts to a level. Synthetic markets have no "real" ICT structure, so this shows what conditions the rule needs — not whether real markets actually provide them.
7. The prop-firm reality check
We also ran the model through a realistic 150K-style evaluation: $9,000 profit target, $4,500 end-of-day drawdown, with a funded year modeled after passing.
| Scenario | Pass eval | Payouts / attempt |
|---|---|---|
| Full model (real contracts) | 6.7% | $9 |
| Full model (exact $200 risk) | 0.2% | $0.46 |
| Zero-edge control (coin flip) | 33% | $794 |
| Sweep-only (real contracts) | 80% | $11,662 |
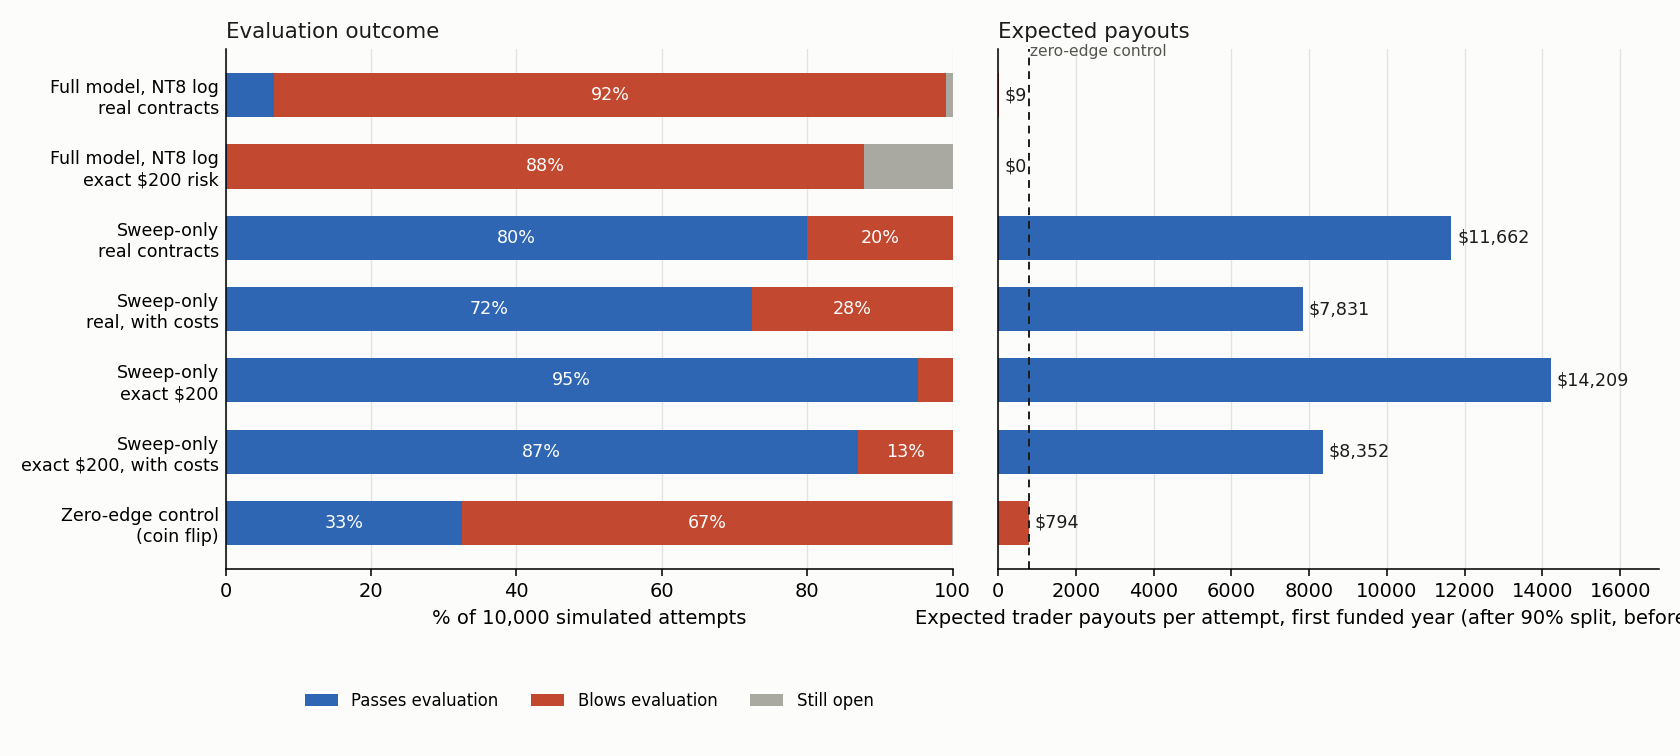
Note the baseline: a coin flip passes about a third of these evaluations, because the target (45R) is roughly twice the drawdown limit (22.5R). So "passes sometimes" means nothing on its own — and the full ICT model passes far less than a coin flip.
8. What this does — and doesn't — establish
What the evidence supports: the full reversal sequence had negative expectancy over 16 years, was negative across the entire parameter grid and in the out-of-sample split, and was indistinguishable from noise (or negative) in synthetic markets. The MSS and FVG filters added nothing beyond a bare sweep.
What it does not establish: that no version of the idea can work. These results depend on one set of rule definitions, bar-based fills (stop assumed first when stop and target hit in the same bar), no commissions in the main figures, and the data limitations noted in Section 2. The sweep-only positive rests on a single, mostly-rising year and decays through it — it needs multi-year testing before anyone relies on it.
Tests still to run
- Full 24-hour NQ history to reproduce the log with true midnight-based levels, plus walk-forward splits.
- A forward-return event study after sweeps vs. random bars, independent of stops and targets.
- Matched-pairs comparison of each filter on identical sweep events.
- Placebo levels, shifted entry times, and replication on ES, MNQ, RTY and YM.
- White's Reality Check / deflated Sharpe to correct for multiple testing, and tick-level replay with a full cost model.
This is how we build everything.
We're not here to defend a model or sell a dream. We test ideas against real data, publish the honest result — and only ship tools we'd trust ourselves. That's the whole philosophy behind Market Monarch.
Educational research — not financial advice. This study is published for informational and educational purposes only. It is not a recommendation to trade, or to avoid trading, any strategy, and nothing here constitutes investment, legal, or tax advice. Market Monarch LLC is a software and educational-technology company, not a registered investment adviser or broker-dealer.
Hypothetical & simulated performance. The results above are based on backtested, hypothetical, and simulated performance, which has inherent limitations. Unlike an actual performance record, simulated results do not represent actual trading and may under- or over-compensate for factors such as liquidity, slippage, and commissions. They are designed with the benefit of hindsight. No representation is being made that any account will or is likely to achieve profits or losses similar to those shown. Past performance — actual or simulated — is not indicative of future results. Trading futures involves substantial risk of loss and is not suitable for all investors.
Independent analysis. "ICT" and "Smart Money Concepts" refer to widely-taught public trading concepts; this is an independent analysis and is not affiliated with or endorsed by any third party.