Bonus Tools
Extra order-flow and trade-management tools that go beyond the core indicators and systems — included as a bonus with select bundles.
 ⤢ Click to enlarge
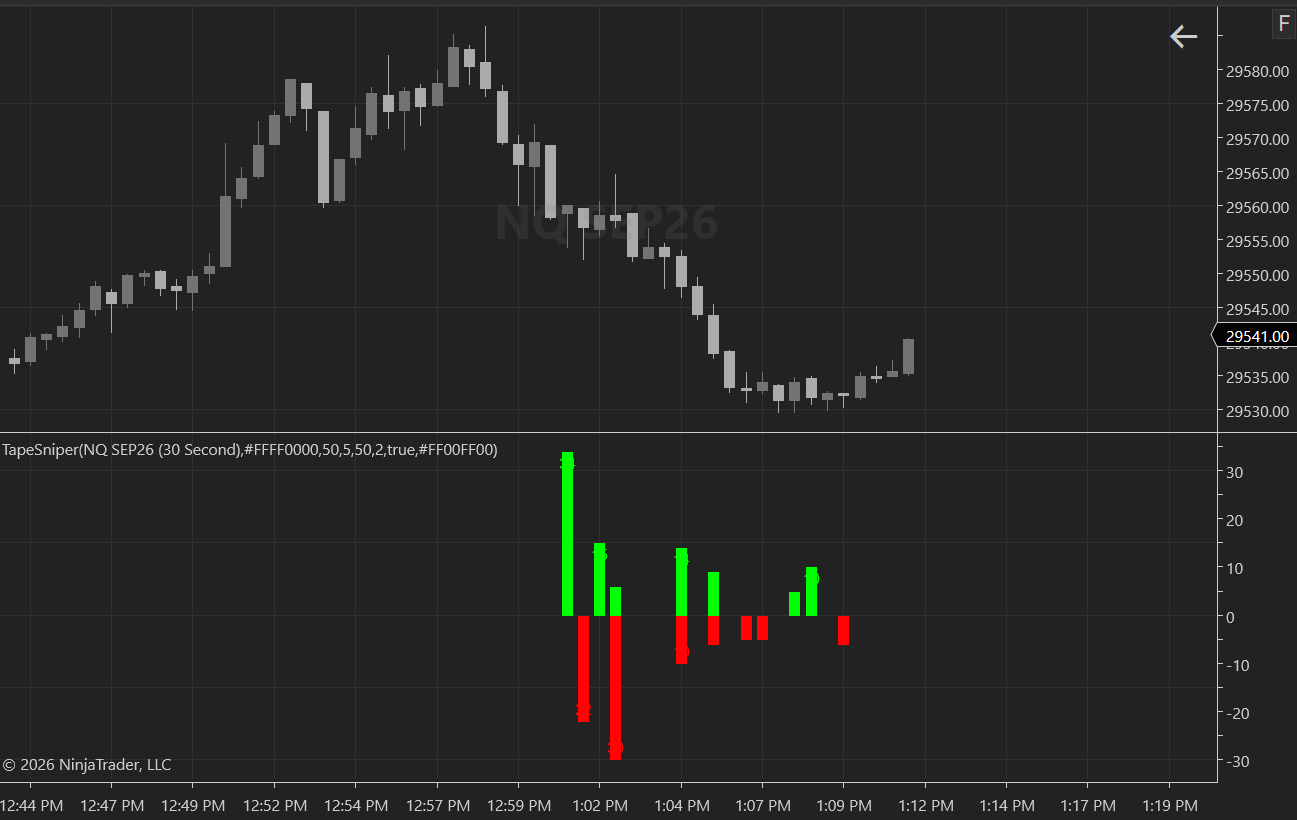
Tape Sniper
Reads the tape — the individual trade prints — and flags single prints that are abnormally large relative to a rolling average print size. It renders in its own panel below the price chart: a green bar for the biggest qualifying buy print in a bar and a red bar for the biggest qualifying sell print, each labeled with the exact contract count. Every large print is classified by aggressor side (traded at or above the ask = buyer-initiated, at or below the bid = seller-initiated), so you can spot where real size is hitting the tape and which side is being aggressive.
Tune the volume multiplier, rolling-average length, and a minimum print size to control how selective it is. Requires a live tick/trade feed (or Tick Replay for historical bars).
 ⤢ Click to enlarge
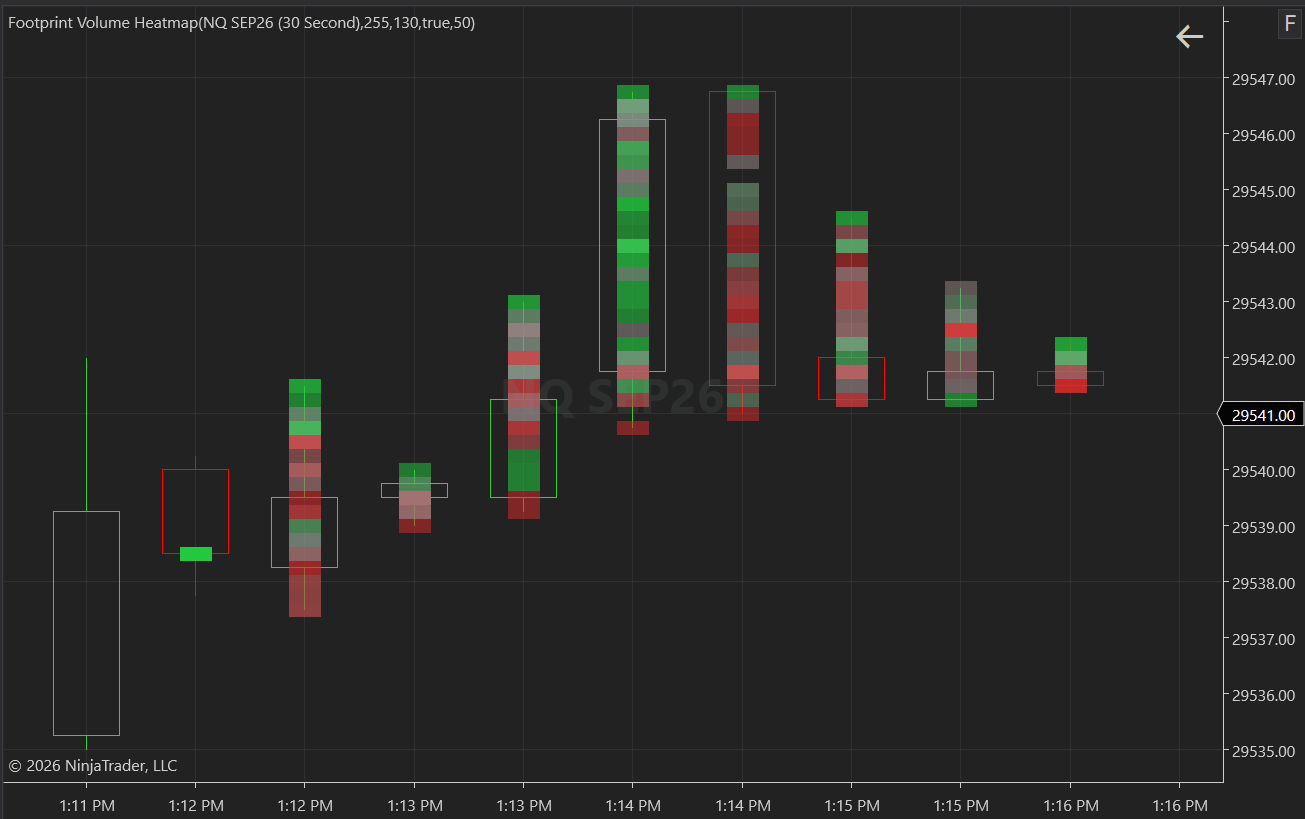
Volume Footprint Heatmap
A footprint-style heatmap of traded buy vs. sell volume at each price, within each bar, painted right on the price panel. Green means buy-dominant at that price, red means sell-dominant, and gray means roughly balanced — while the amount of volume traded at a price drives how solid (opaque) the cell is. It condenses a full footprint into one color-coded cell per price per bar, so you can instantly see where volume concentrated and who was in control at each level.
Runs on Level 1 data only — top-of-book quotes plus trade prints — so no market-depth subscription is required. Opacity and saturation are adjustable, or let it auto-normalize each bar's busiest price.
 Coming soon
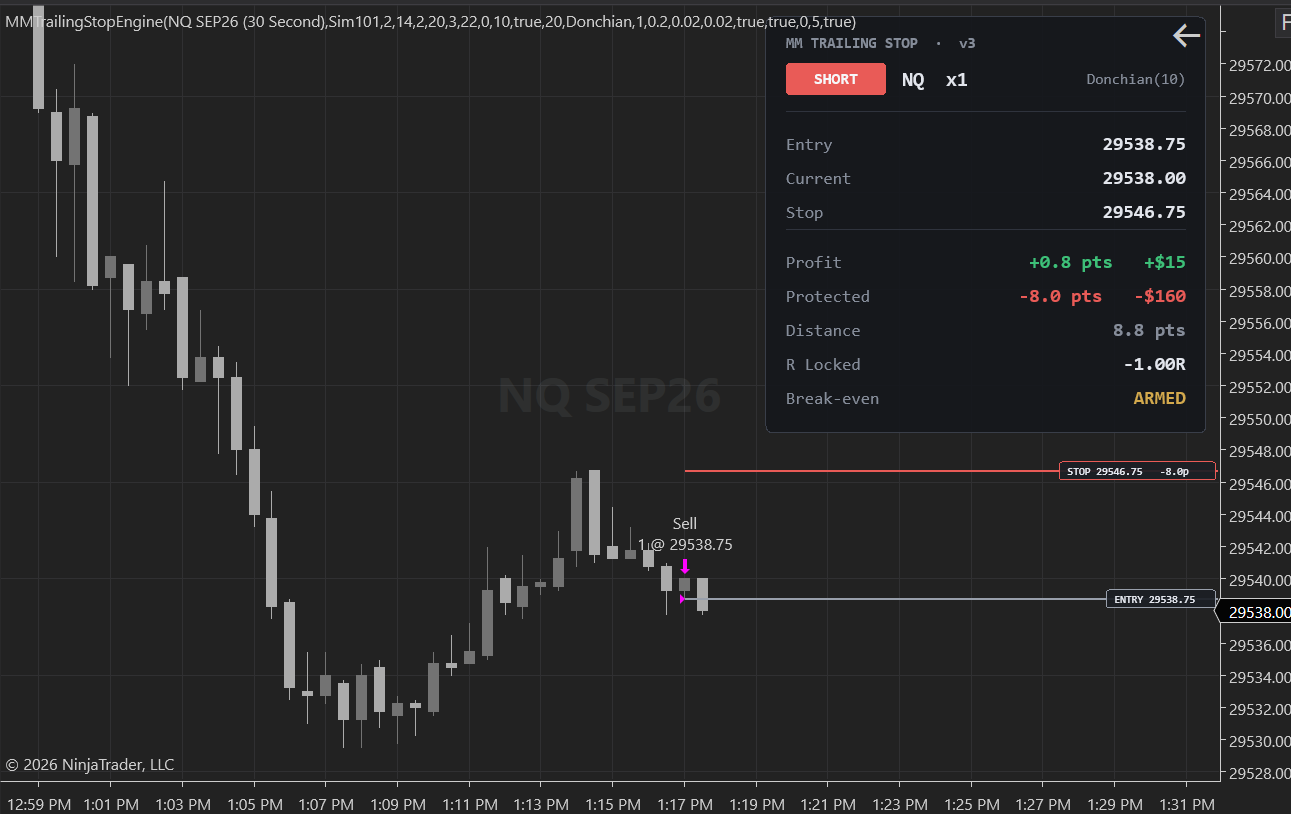
Trailing Stop Engine
A visual, forward-locking trailing stop for manually-entered positions. It detects your account's position automatically (including manual fills), then draws your trailing stop, break-even level, and entry on the chart alongside a clean HUD showing profit, protected profit, distance, and R locked in. The trail only ever ratchets toward price — it never loosens. Choose from multiple trailing methods — Fixed points, Percent, ATR, Chandelier, Donchian, Parabolic SAR, or Swing structure — plus an optional automatic break-even. It is visual and alerts only; it never submits or manages a real order.
This tool is in active development and coming soon to Bonus Tools.
 Coming soon
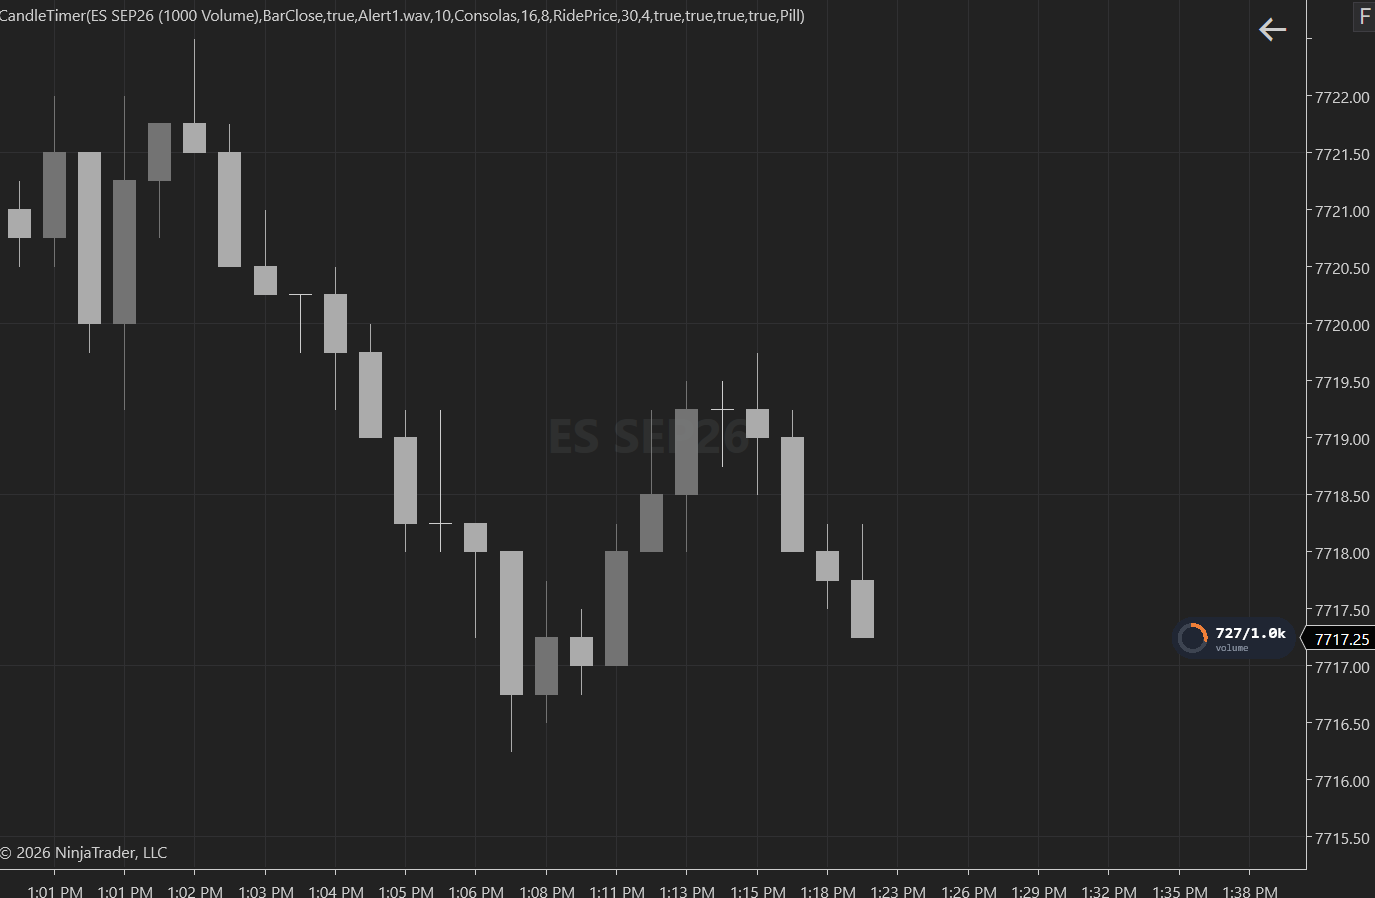
Candle Timer
A live bar-close countdown with a depleting, color-grading progress ring (green → amber → red) and a clean monospace readout, so you always know exactly how much is left before the current bar closes. It works on time, tick, volume, and range charts — showing seconds, ticks, volume, or percent as appropriate — with close and threshold alerts, a new-bar completion pulse, placement presets, and quick theme presets.
This tool is in active development and coming soon to Bonus Tools.
Want the bonus tools?
They come included with the Market Intelligence Bundle, Automated: Elite, and Monarch Pro.
View pricing