Step 1 – Download Your Strategy
After completing your purchase, download the strategy .zip file from your Market Monarch account or the download link provided in your purchase email.
Save the file somewhere easy to find, such as your Downloads folder.
Do not unzip or extract the file. NinjaTrader imports the ZIP file directly.
Step 2 – Open NinjaTrader 8
Launch NinjaTrader 8 and allow the platform to fully load until the Control Center appears.
Step 3 – Import the Strategy
- Click Tools on the Control Center.
- Select Import → NinjaScript Add-On...
- Browse to the downloaded .zip file.
- Select the file and click Open.
- Click Yes if NinjaTrader asks for confirmation.
The platform will now compile the strategy. This process may take several seconds depending on your computer.
If the import is successful, NinjaTrader will display an Import Successful message.
Step 4 – Connect to Your Brokerage or Simulation Account
Before running an automated strategy, you must connect to an account.
From the Control Center, click Connections and choose the account you wish to use.
Examples include:
- Sim101 (Simulation)
- NinjaTrader Brokerage
- Tradovate
- Rithmic
- Interactive Brokers
- Other supported broker connections
Wait until the connection indicator turns green, confirming you are connected to the market.
Step 5 – Open a Chart
From the Control Center:
New → Chart
Select:
- Your trading instrument (Example: NQ, MNQ, ES, MES)
- Contract month
- Timeframe required by the strategy
Click OK to open the chart.
Important: Always use the chart timeframe specified in the product documentation. Running the strategy on an unsupported timeframe may produce unexpected results.
Step 6 – Verify Historical Data
Allow the chart to load enough historical data before enabling the strategy.
Many automated strategies require historical bars to calculate indicators before they begin trading.
Wait until the chart has completely finished loading.
Step 7 – Apply the Strategy
Right-click anywhere on the chart.
Select:
Strategies...
Locate your Market Monarch strategy from the list.
Select it and click Add (or double-click the strategy name).
The strategy settings window will appear.
Step 8 – Configure Your Settings
Before enabling the strategy, review every setting carefully.
Common settings include:
- Position Size (Quantity)
- Stop Loss
- Profit Target
- Trading Session
- Maximum Daily Loss
- Maximum Trades Per Day
- Entry Filters
- Indicator Parameters
- Trading Hours
- News Filters (if applicable)
Adjust these settings according to your trading plan.
Step 9 – Select Your Trading Account
Within the strategy settings, locate the Account dropdown.
Choose the account you want the strategy to trade on.
Examples:
- Sim101 (Recommended)
- Your Live Brokerage Account
Always double-check that the correct account is selected before enabling the strategy.
Step 10 – Enable the Strategy
After reviewing all settings:
- Check the Enabled box.
- Click Apply.
- Click OK.
Your strategy is now active.
The strategy will continuously monitor the market and automatically submit orders whenever its programmed conditions are met.
Step 11 – Monitor the Strategy
Even though the strategy is automated, you should continue monitoring it throughout the trading session.
Regularly check:
- Strategy performance
- Open positions
- Working orders
- Connection status
- Platform messages
- Account balance
Never leave an automated strategy unattended for extended periods without understanding its behavior.
Step 12 – Stopping the Strategy
To disable the strategy:
- Right-click the chart.
- Select Strategies...
- Uncheck Enabled.
- Click Apply.
- Click OK.
The strategy will stop submitting new trades.
Depending on your strategy settings, any open positions may remain open or may be closed automatically. Refer to the product documentation for your specific strategy's behavior.
Updating Your Strategy
When a new version is released:
- Disable the strategy.
- Remove it from any active charts.
- Navigate to Tools → Import → NinjaScript Add-On...
- Import the updated .zip file.
- Reapply the strategy to your chart.
- Verify all settings before enabling it again.
Troubleshooting
The strategy does not appear in the list.
- Confirm the import completed successfully.
- Restart NinjaTrader.
- Verify you imported the original ZIP file.
The strategy won't enable.
Make sure:
- You are connected to a brokerage or simulation account.
- The chart has finished loading.
- The correct instrument and timeframe are being used.
- There are no compilation errors shown in the NinjaScript Editor.
The strategy isn't taking any trades.
Possible reasons include:
- Entry conditions have not been met.
- Market is outside the configured trading hours.
- Position limits have been reached.
- Daily risk limits have been triggered.
- Required market conditions are not currently present.
The strategy disables itself.
Review the Log tab in the Control Center for any error messages. Common causes include connection interruptions, invalid order parameters, insufficient account permissions, or rejected orders.
Best Practices
For the best experience using Market Monarch automated strategies:
- Begin on a Sim101 account until you are comfortable with the strategy.
- Review all settings before enabling automated trading.
- Use the recommended instrument and chart timeframe.
- Keep NinjaTrader updated to the latest stable version.
- Ensure you have a reliable internet connection during trading hours.
- Monitor the strategy throughout the trading session.
- Read the product documentation to understand how the strategy enters, manages, and exits trades
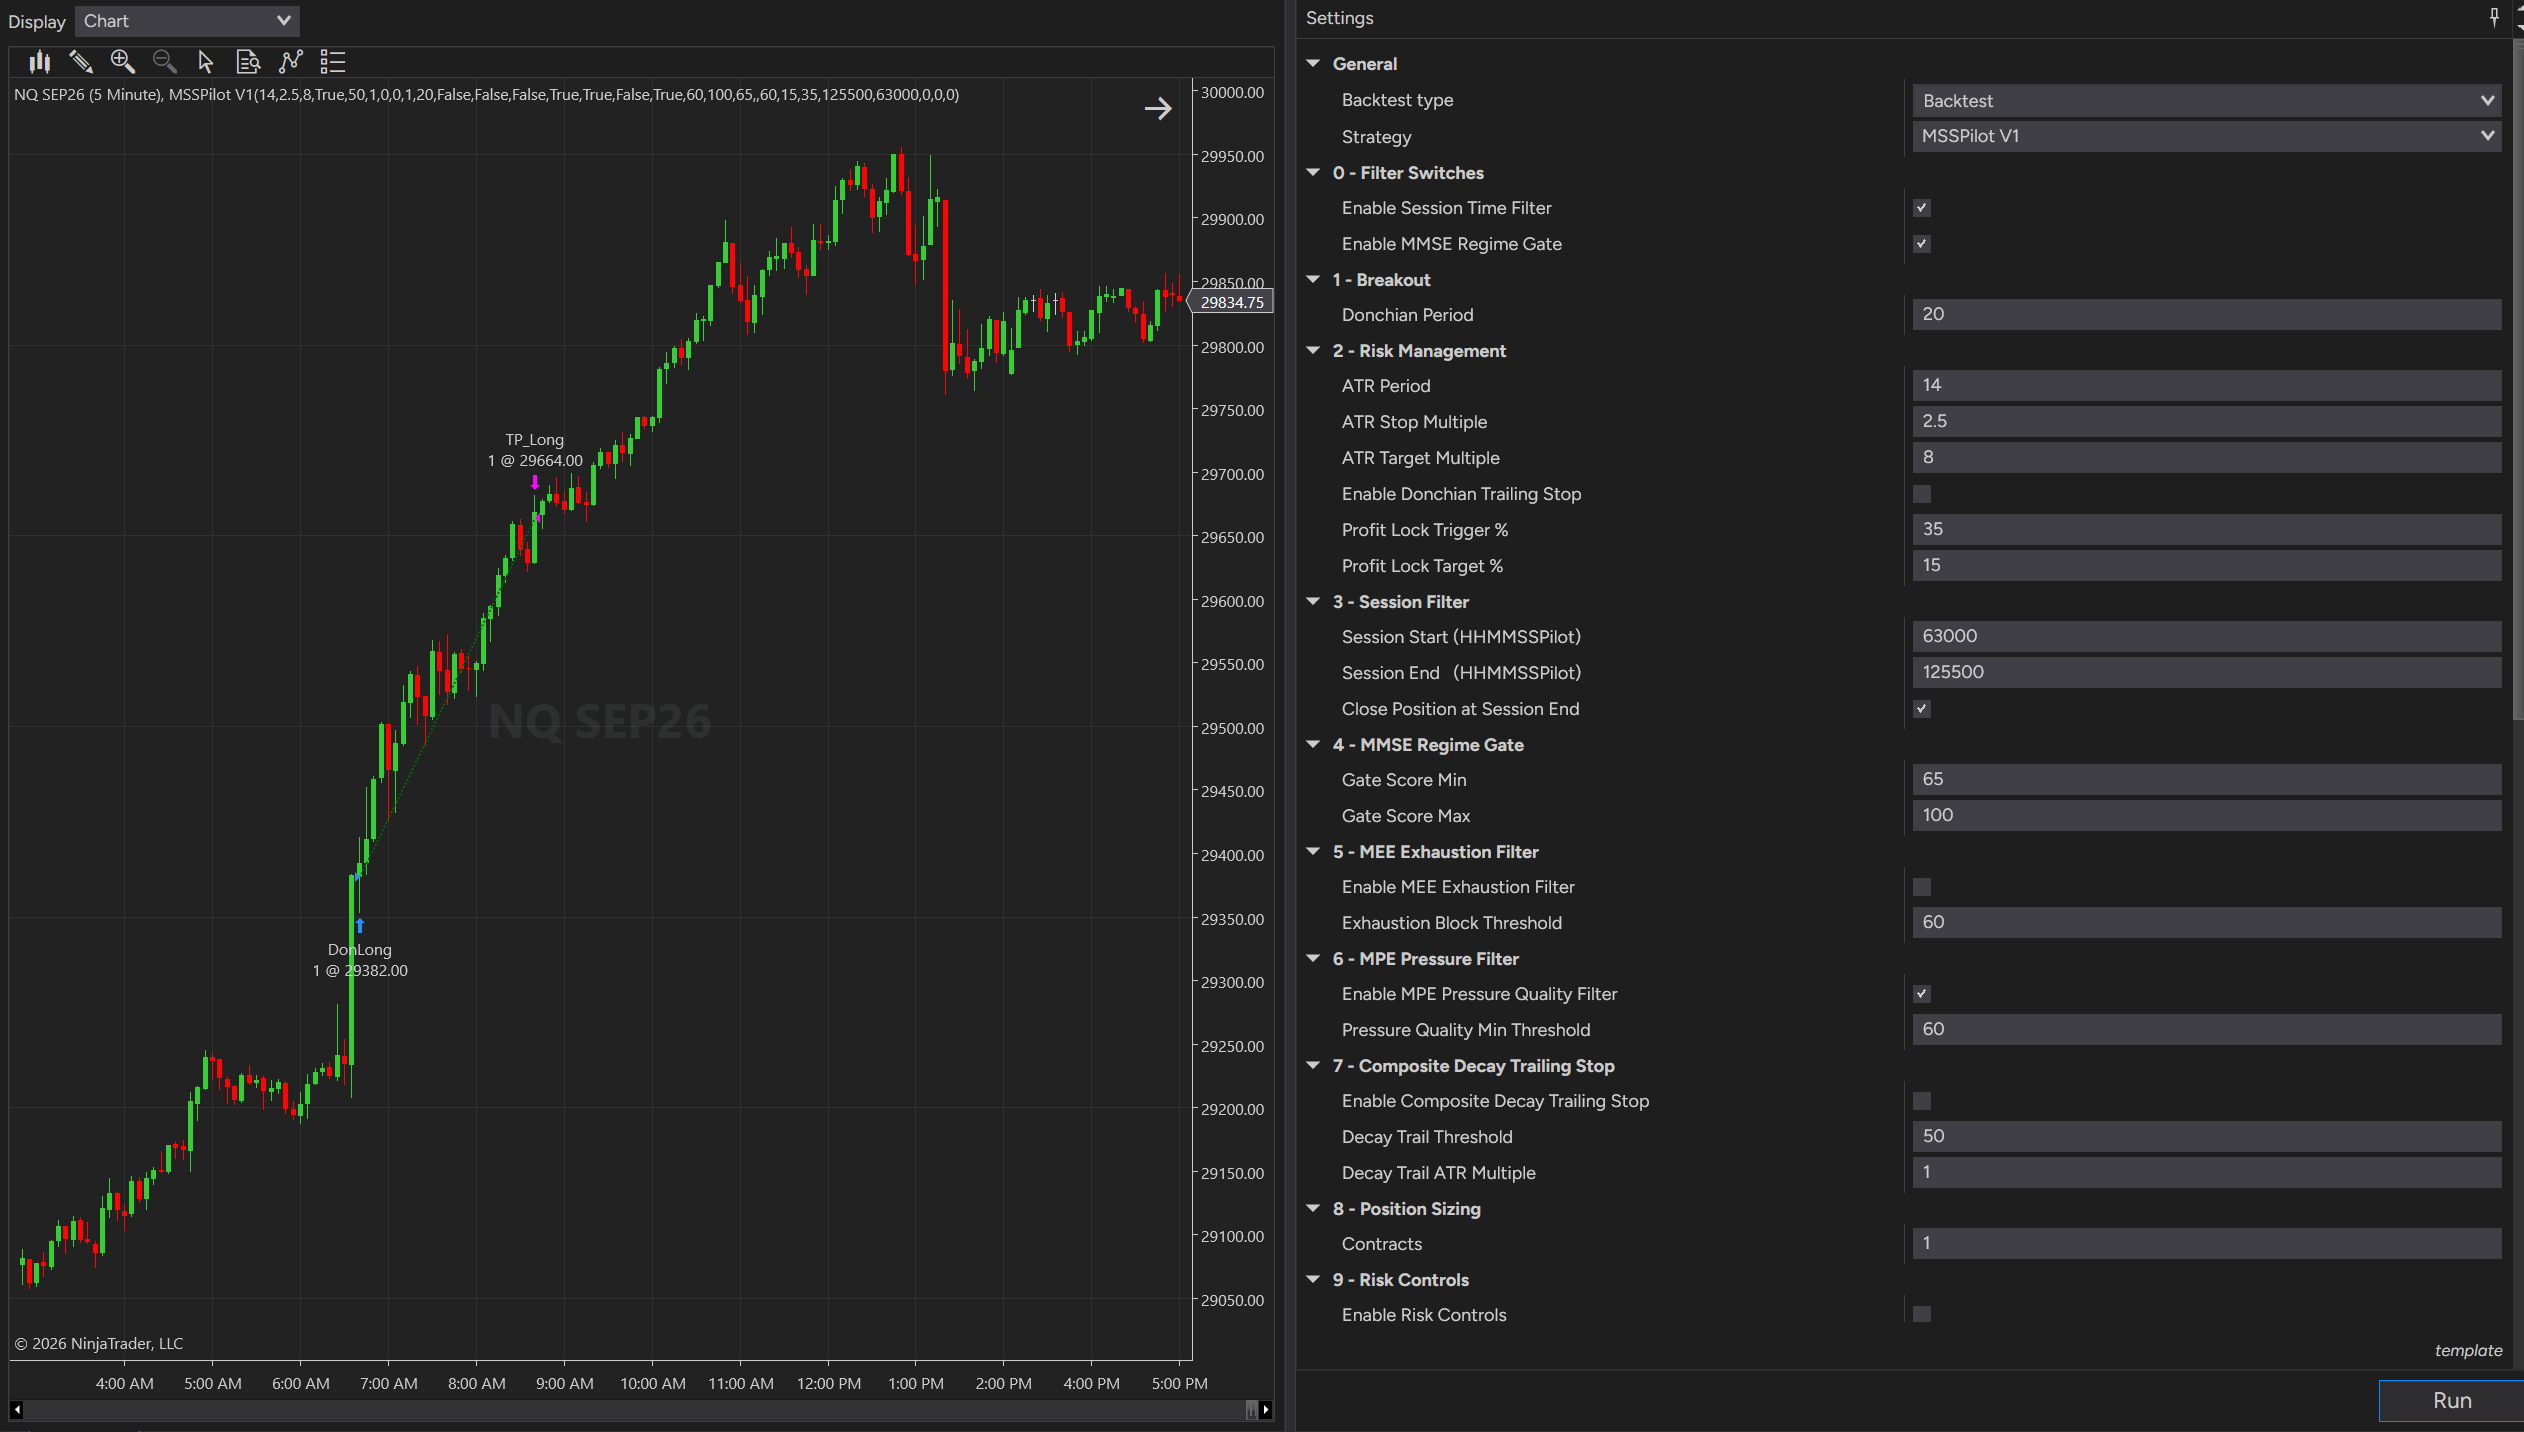
MSS Pilot — User Guide
Type: NinjaTrader 8 Strategy (automated, places real orders) What it does: A Donchian-channel breakout strategy with a layered stop system — one base ATR stop plus three independent, optional tightening mechanisms — combined with regime, exhaustion, and pressure-based entry filters, and an opt-in risk-control section for halting the strategy under adverse conditions.
Not financial advice. This guide explains installation, configuration, and monitoring. It isn't a recommendation to run this strategy live, and nothing here is trading or investment advice — you are responsible for your own testing, risk tolerance, and capital.
1. What Problem This Solves
Breakout strategies are simple to describe but easy to get wrong in the details: a fixed stop can be too tight for the very volatility spike that defines a breakout, while a purely trailing stop can give back too much profit before locking anything in. MSS Pilot addresses this by giving every trade a solid ATR-based starting stop, then layering up to three independent, one-way-ratchet tightening mechanisms on top — each of which can only move the stop closer to price, never further away, so they can never undo each other's work. On the entry side, it can optionally require a favorable market regime, filter out already-stretched (exhausted) moves, and require "real" (structurally-backed) buying/selling pressure before taking a trade.
3. How It Works (Plain English)
Entry
The strategy trades a breakout , evaluated every bar (not anchored to a session open like an Opening Range Breakout): - Long when price closes above the highest high of the last N bars (excluding the current bar). - Short when price closes below the lowest low of the same window.
The Stop System — One Base, Three Optional Tighteners
Every trade starts with a base ATR stop , set once at entry: entry price ± (ATR Stop Multiple × ATR) . This never changes on its own. Three separate, independently-toggleable mechanisms can subsequently tighten that stop as the trade develops — none of them can ever loosen it, and since all three follow the same one-way-ratchet rule, they cannot undo each other. At any moment, the active stop is simply whichever mechanism has pushed furthest toward price so far:
- Profit Lock — once price has moved a configurable percentage of the way toward the target, the stop moves once to lock in a percentage of that distance as guaranteed profit.
- Donchian Trailing Stop (optional) — re-evaluates the same Donchian channel used for entry, every bar, and ratchets the stop to the channel's opposite side whenever that's more favorable than the current stop. This is meant to avoid a fixed ATR stop being tighter than the market's own recent structure — which can happen right at a breakout, since volatility is often elevated specifically because a breakout is occurring.
- Composite Decay Trailing Stop (optional) — once the MMSE regime "Composite" score (see below) falls below a threshold while you're in a trade, the stop switches to a continuously-recalculated ATR-distance trail from current price. Once this activates for a trade, it keeps trailing for the rest of that trade even if the Composite score later recovers — there's no "freeze and stop trailing" if conditions improve again.
Target
Fixed at entry, never trailed: entry price ± (ATR Target Multiple × ATR) .
Entry Filters (all optional)
- Session Time Filter — restricts trading to a configured time window, with an option to flatten any open position at session end.
- MMSE Regime Gate — requires an internal 0–100 "Composite" market-regime score (assessing trend strength/structure) to fall within a configured band before allowing entries. Default band targets stronger trending conditions.
- MEE Exhaustion Filter — blocks entries when an internal "Exhaustion" score is too high, i.e. when the recent move already looks stretched — meant to avoid entering late, just before a move reverses.
- MPE Pressure Quality Filter — requires an internal "Pressure Quality" score to be high enough, i.e. requires that current buy/sell pressure looks structurally backed rather than noisy.
(The exact internal calculations behind the MMSE/MEE/MPE scores are part of the strategy's regime-detection engine and are not detailed further in this guide — what matters for configuration is that each is a 0–100 score with a corresponding threshold or band you can tune.)
Risk Controls (optional, master-switch gated)
When enabled, the strategy can automatically halt itself — permanently for the run, or just for the rest of the day — based on win/loss streaks, total win count, or daily dollar P&L limits. A halt only ever blocks new entries; it never force-closes an already-open position. Anything already in a trade continues to be managed by its native stop, target, and any active trailing mechanisms.
4. Settings Reference
0 - Filter Switches
Enable Session Time Filter
- Description: When off, trades all hours
Enable MMSE Regime Gate
- Description: Requires the Composite score to fall inside the configured band
1 - Breakout
Donchian Period
- Description: Lookback for the entry channel (and, if enabled, the Donchian Trailing Stop)
2 - Risk Management
ATR Period
- Description: Used for the entry stop, profit target, and Composite Decay trail
ATR Stop Multiple
- Description: Base stop distance from entry, as a multiple of ATR, set once at entry
ATR Target Multiple
- Description: Profit target distance from entry, fixed, never trailed
Enable Donchian Trailing Stop
- Description: Turns on tightener #2 (see above)
Profit Lock Trigger %
- Description: % of the distance to target that must be covered before the stop locks once;
0disables Profit Lock entirely
Profit Lock Target %
- Description: % of the entry-to-target distance locked in as profit once triggered
3 - Session Filter
Session Start (HHMMSS)
- Description: Start of the trading window
- Default:
0(midnight)
Session End (HHMMSS)
- Description: End of the trading window
- Default:
235959
Close Position at Session End
- Description: Flattens any open position when the session window ends
4 - MMSE Regime Gate
Gate Score Min
- Description: Minimum Composite score required for entry
Gate Score Max
- Description: Maximum Composite score allowed for entry
5 - MEE Exhaustion Filter
Enable MEE Exhaustion Filter
- Description: Blocks entries when Exhaustion is too high
Exhaustion Block Threshold
- Description: Entries blocked when Exhaustion score is above this value
6 - MPE Pressure Filter
Enable MPE Pressure Quality Filter
- Description: Requires Pressure Quality above the threshold
Pressure Quality Min Threshold
- Description: Minimum Pressure Quality score required for entry
7 - Composite Decay Trailing Stop
Enable Composite Decay Trailing Stop
- Description: Turns on tightener #3 (see above)
Decay Trail Threshold
- Description: Composite score level below which the decay trail activates
Decay Trail ATR Multiple
- Description: ATR distance the trail maintains from current price once active
8 - Position Sizing
Contracts
- Description: Number of contracts/shares submitted per entry
- Default:
1
9 - Risk Controls
Enable Risk Controls
- Description: Master switch — while off, nothing else in this section does anything
Stop after total wins
- Description: Permanently halts the run after this many total wins (
0= off)
Stop after consecutive wins
- Description: Permanently halts after this many wins in a row (
0= off)
Stop after consecutive losses
- Description: Permanently halts after this many losses in a row (
0= off)
Daily loss limit ($)
- Description: Halts for the rest of the day if hit; resets next day (
0= off)
Daily profit stop ($)
- Description: Halts for the rest of the day if hit; resets next day (
0= off)
5. How the Stop Mechanisms Interact
Because all three optional tighteners (Donchian Trail, Profit Lock, Composite Decay Trail) follow the same rule — "only move the stop if the new level is more favorable than the current one" — you can safely enable more than one at a time. Whichever mechanism has moved the stop closest to price at any given moment is simply the one currently in effect; none of them can push it back out again. This means:
- Enabling only the base ATR stop (all three tighteners off) gives you the simplest, most predictable stop behavior.
- Enabling Profit Lock alone gives you a one-time move to guaranteed profit partway through a winning trade.
- Enabling Donchian Trailing Stop alone continuously re-anchors your stop to actual recent market structure rather than a fixed distance.
- Enabling Composite Decay Trailing Stop alone starts tightening the stop specifically once market conditions (per the Composite score) start deteriorating, and keeps tightening for the rest of that trade even if conditions later improve.
- Any combination is valid — since they can't fight each other, more tighteners generally means the stop can only ever end up as tight or tighter, never looser.
6. Suggested Starting Points
- Start simple: run with just the base ATR stop and Profit Lock (both effectively on by default), no additional filters, to get a feel for the raw breakout behavior first.
- Choppy/false-breakout-prone instruments: consider enabling the MMSE Regime Gate to only trade when the broader regime looks trend-favorable.
- Catching moves too late: try enabling the MEE Exhaustion Filter to skip entries where the move already looks stretched.
- Filtering noisy breakouts: try the MPE Pressure Quality Filter to require more structurally-backed buying/selling pressure before entry.
- Volatile breakout instruments: consider enabling the Donchian Trailing Stop so your stop reflects actual market structure rather than a fixed ATR distance that might be tighter than the breakout's own natural noise.
- Always test each filter/tightener individually first before combining several, so you understand what each one is doing to your results.
7. Troubleshooting
Strategy never enters a trade
- Likely Cause: One or more filters (Session, MMSE Gate, MEE, MPE) is blocking every candidate, or Risk Controls has halted the strategy
- Fix: Temporarily disable filters one at a time to isolate which is blocking; check for a halt condition if Risk Controls is on.
Stop doesn't seem to move even with a tightener enabled
- Likely Cause: The relevant tightener's condition hasn't been met yet (e.g. Composite hasn't fallen below the Decay Trail Threshold, or price hasn't reached the Profit Lock trigger %)
- Fix: This is expected — each tightener only activates once its own condition is met.
Strategy halted and won't resume
- Likely Cause: A permanent halt condition fired under Risk Controls (total wins, win streak, or loss streak cap)
- Fix: This requires removing and re-adding the strategy (or otherwise resetting it) to resume, by design — it's meant to be a hard stop.
Strategy stopped trading for the day but resumed the next day
- Likely Cause: A daily-only halt (Daily loss limit or Daily profit stop) was hit — these reset automatically each new day
- Fix: This is expected behavior, not an error.
Open position wasn't closed when the strategy halted
- Likely Cause: By design — a halt only blocks new entries; existing positions continue to be managed by their native stop/target/trailing logic
- Fix: This is intentional; disable Risk Controls or manually manage the position if you want different behavior.
Regime/Exhaustion/Pressure filters seem to behave unpredictably
- Likely Cause: These are internal composite scores built from multiple market-condition measurements; behavior can vary meaningfully by instrument and timeframe
- Fix: Test each filter individually with a wide date range before relying on it, and adjust its threshold/band to match what you observe.
Quick Start Summary
- Add the strategy to your chart (named MSSPilot in the strategy list; nicknamed MSS Pilot ).
- Set Donchian Period , ATR Period , ATR Stop Multiple , and ATR Target Multiple for your instrument and timeframe.
- Leave the optional stop tighteners and entry filters off at first to understand the raw breakout behavior, then enable them one at a time.
- Configure the Session Time Filter to match your intended trading hours.
- Turn on Enable Risk Controls if you want automated halting based on streaks or daily P&L limits — remember a halt only stops new entries, never force-closes open trades.
- Always test thoroughly on Sim/replay or in Strategy Analyzer before running live.
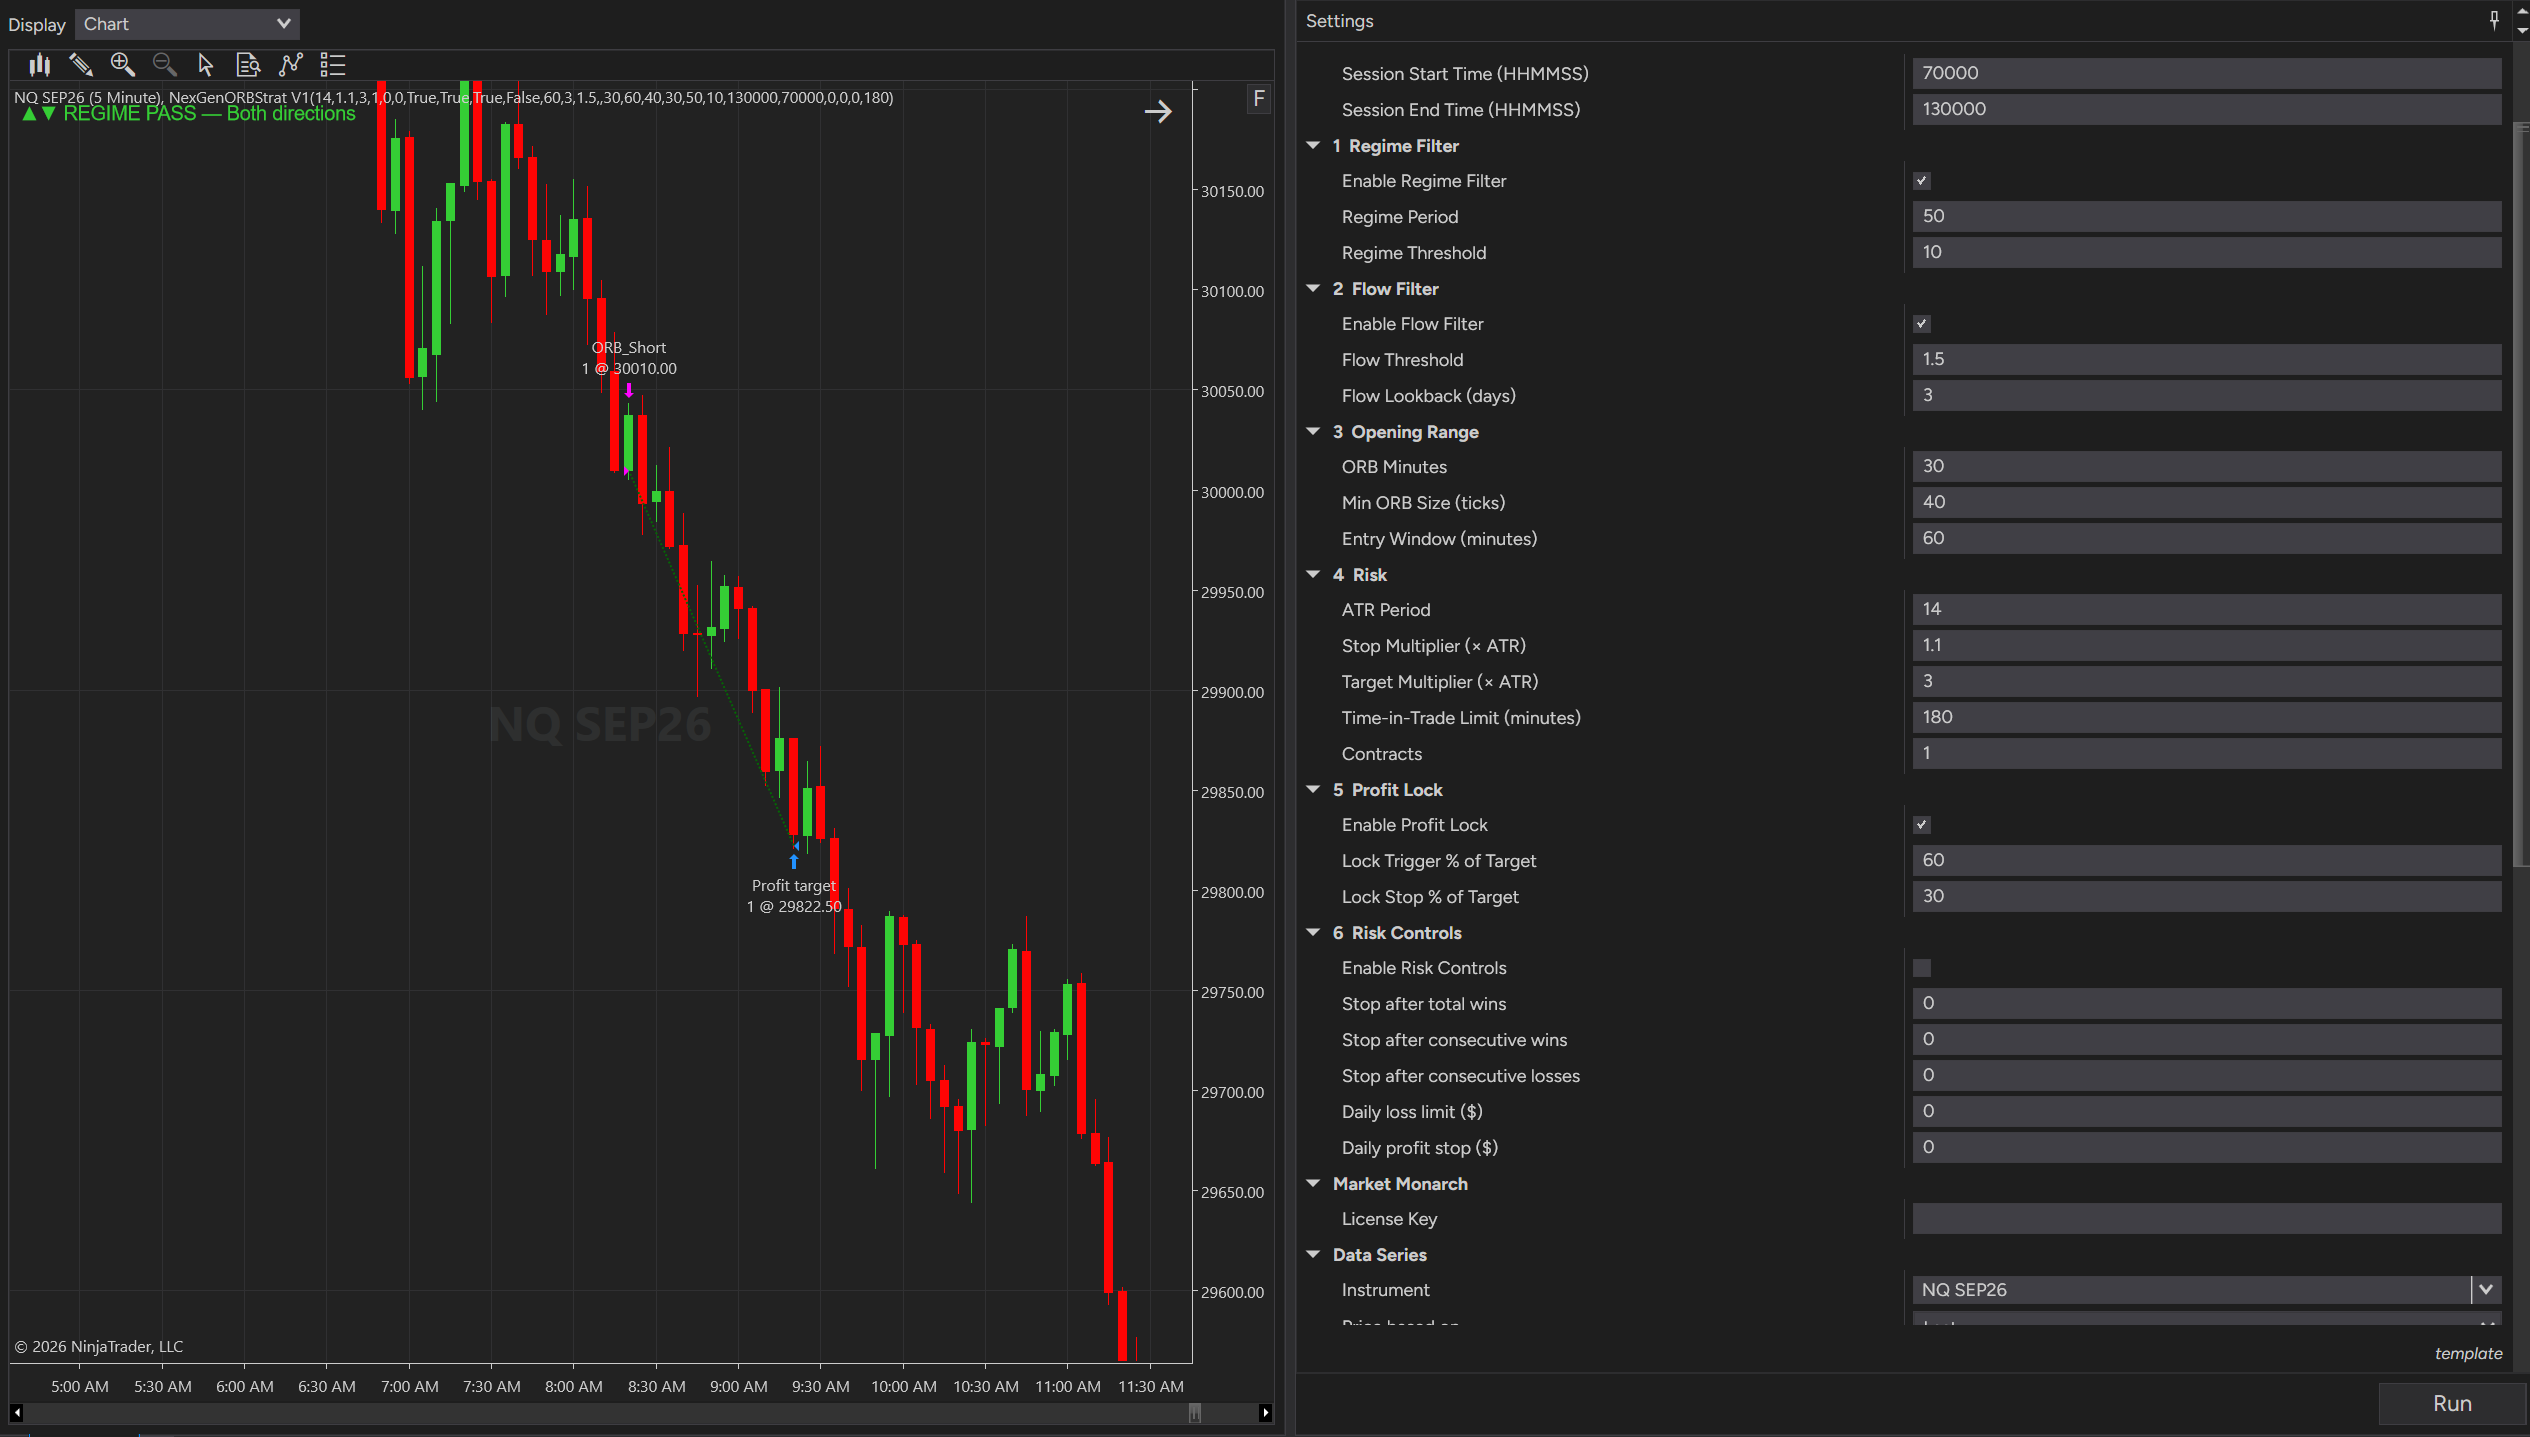
NexGen ORB Strategy — User Guide
Type: NinjaTrader 8 Strategy (automated, places real orders) What it does: The automated trading counterpart to the NexGen ORB indicator. Builds an Opening Range Breakout each session, optionally qualifies the day and the breakout itself through Regime and Flow filters, then enters with an ATR-based bracket, an optional one-time profit lock, a time-in-trade exit, and a full opt-in risk-control section for halting the strategy under adverse conditions.
Not financial advice. This guide covers installation, configuration, and monitoring. It isn't a recommendation to trade this strategy live, and nothing here is trading or investment advice — you're responsible for your own testing, risk tolerance, and capital.
Note: Some of this strategy's internal filter logic (exactly how the Regime and Flow filters qualify a day or a breakout) is proprietary and intentionally not detailed in this guide, consistent with the companion NexGen ORB indicator.
1. What Problem This Solves
A plain Opening Range Breakout takes every breakout of the day's early range, regardless of whether the broader conditions or the breakout's own participation actually support it. NexGen ORB Strategy adds two independent, optional qualification layers — a once-per-day Regime check and a per-breakout Flow check — on top of the same core ORB mechanics as the companion indicator, then manages the resulting trade with an ATR bracket, an optional profit lock, and a time-based exit, plus a full risk-control layer for automated halting.
2
3. How It Works (Plain English)
- Session window: Only bars between your Session Start Time and Session End Time are considered; everything resets fresh each new day.
- Regime check (once per day): If enabled, at the start of each day the strategy checks a regime-strength reading against your threshold. If it doesn't qualify, the entire day is skipped — no ORB is even built, and an on-chart label shows the day's status ("REGIME BLOCKED," "REGIME PASS," or "NO FILTER" if the filter is off).
- Building the Opening Range: For the first ORB Minutes of a qualifying day, the strategy tracks the highest high and lowest low, forming the day's range. If Min ORB Size (ticks) is set and the range is too narrow, that day is invalidated.
- Entry window: Once the range is stamped, the strategy watches for a close-confirmed breakout above or below the range for a limited window ( Entry Window (minutes) ).
- Flow check (per breakout): If enabled, a candidate breakout must also show above-baseline participation for that specific point in the session, compared to recent history at that same time of day, before it's accepted.
- Entry & bracket: On a qualifying breakout, the strategy enters with an ATR-based stop and target. Only one trade is taken per day.
- Trade management: While in a trade, an optional Profit Lock can move the stop to lock in a portion of profit once price has covered enough of the distance to target. An optional Time-in-Trade Limit will exit the position automatically after a set number of minutes, regardless of where price is.
- Risk Controls (optional): Can automatically halt new entries — permanently for the run, or just for the rest of the day — based on win/loss streaks, total wins, or daily dollar P&L. A halt only blocks new entries; it never force-closes an open position.
4. Settings Reference
0. Session
Session Start Time (HHMMSS)
- Description: First bar of the trading day to consider
- Default:
070000(7:30:00 AM)
Session End Time (HHMMSS)
- Description: No new entries considered after this time
- Default:
130000(1:00:00 PM)
1. Regime Filter
Enable Regime Filter
- Description: When on, an entire day is skipped unless the regime reading at the open qualifies
Regime Period
- Description: Lookback for the regime reading
Regime Threshold
- Description: Minimum regime reading required to trade the day
2. Flow Filter
Enable Flow Filter
- Description: When on, a breakout is only taken if it shows above-baseline flow for that time of day
Flow Threshold
- Description: Minimum flow ratio required to confirm a breakout;
1.5= good,2.0= excellent, per the strategy's own guidance
Flow Lookback (days)
- Description: Number of recent days averaged to build the time-of-day flow baseline
3. Opening Range
ORB Minutes
- Description: Length of the opening range window, in minutes
Min ORB Size (ticks)
- Description: Minimum acceptable range size; smaller ranges invalidate the day (
0= disabled)
Entry Window (minutes)
- Description: How long after the range is stamped a new breakout is still considered
4. Risk
ATR Period
- Description: Lookback for the ATR used to size stop/target distances
Stop Multiplier (× ATR)
- Description: Stop-loss distance, as a multiple of ATR
Target Multiplier (× ATR)
- Description: Take-profit distance, as a multiple of ATR
Time-in-Trade Limit (minutes)
- Description: Automatically exits the position after this many minutes in the trade (
0= disabled)
Contracts
- Description: Number of contracts/shares submitted per entry
5. Profit Lock
Enable Profit Lock
- Description: Turns on the one-time stop adjustment
Lock Trigger % of Target
- Description: % of the distance to target that must be covered before the stop moves
Lock Stop % of Target
- Description: % of the target distance the stop moves to once triggered
6. Risk Controls
Enable Risk Controls
- Description: Master switch — while off, nothing else in this section does anything
Stop after total wins
- Description: Permanently halts the run after this many total wins (
0= off) - Default:
0
Stop after consecutive wins
- Description: Permanently halts after this many wins in a row (
0= off) - Default:
0
Stop after consecutive losses
- Description: Permanently halts after this many losses in a row (
0= off) - Default:
0
Daily loss limit ($)
- Description: Halts for the rest of the day if hit; resets next day (
0= off) - Default:
0
Daily profit stop ($)
- Description: Halts for the rest of the day if hit; resets next day (
0= off) - Default:
0
5. Reading the Chart
- Blue dashed lines labeled with the ORB high/low — the day's opening range, drawn once it's stamped.
- Top-left status label:
- "↕ NO FILTER — Both directions" — Regime Filter is off; every valid breakout is considered.
- "● REGIME BLOCKED — Sit out today" — the day failed the Regime check; no ORB or trade will occur.
- "▲▼ REGIME PASS — Both directions" — the day qualified; breakouts in either direction are eligible.
- No trade on an otherwise-valid day — either the breakout failed the Flow check, the entry window closed before a breakout occurred, or Risk Controls has halted new entries.
- NinjaScript Output window (Control Center → New → NinjaScript Output) — logs detailed per-bar status, including ORB building, Regime/Flow check results, entries, profit lock triggers, time exits, and halts. This is the best place to diagnose why a specific day did or didn't trade.
6. Suggested Starting Points
- Start simple: leave the Regime and Flow filters off first to see how the raw ORB breakout behaves on your instrument.
- Add the Regime Filter if you want to skip entire days that don't look strong enough to support a breakout continuation, by your criteria.
- Add the Flow Filter if you want to require a genuine participation surge on the breakout bar itself, adjusted for the natural shape of volume across the session (heavier at the open, lighter midday).
- Use Profit Lock and the Time-in-Trade Limit together for a more managed exit approach rather than relying solely on the ATR bracket.
- Turn on Risk Controls once you're comfortable with the base strategy's behavior, to add automated guardrails around win/loss streaks or daily P&L.
- Always test on Sim/replay first , and review the NinjaScript Output log closely to confirm the strategy is behaving as you expect before running it live.
7. Troubleshooting
No trade on an entire day, no ORB drawn
- Likely Cause: Enable Regime Filter is on and that day didn't qualify — check the top-left status label and NinjaScript Output
- Fix: Temporarily disable the Regime Filter to confirm, or lower Regime Threshold .
ORB drawn but no trade taken
- Likely Cause: Breakout didn't occur within the Entry Window , failed the Flow Filter , or Risk Controls has halted new entries
- Fix: Check NinjaScript Output for the specific reason logged; try disabling the Flow Filter temporarily to isolate it.
Trade exited earlier than expected
- Likely Cause: Time-in-Trade Limit (minutes) triggered, or Profit Lock moved the stop and it was then hit
- Fix: Check NinjaScript Output for a "TIME EXIT" or "PROFIT LOCK" log line around that time.
Strategy halted and won't resume
- Likely Cause: A permanent halt condition fired under Risk Controls (total wins, win streak, or loss streak cap)
- Fix: This requires removing and re-adding the strategy (or otherwise resetting it) to resume, by design.
Strategy stopped for the day but resumed the next day
- Likely Cause: A daily-only halt (Daily loss limit or Daily profit stop) was hit — these reset automatically each day
- Fix: This is expected behavior.
Open position wasn't closed when a halt triggered
- Likely Cause: By design — a halt only blocks new entries; the open position continues to be managed by its native stop/target, profit lock, and time exit
- Fix: This is intentional.
Quick Start Summary
- Add the strategy to your chart (named NexGenORBStrat in the strategy list; nicknamed NexGen ORB Strategy ).
- Set Session Start/End Time to match your actual trading hours.
- Leave the Regime and Flow filters off initially to observe raw ORB behavior, then enable either or both once ready.
- Configure your Risk settings (ATR period/multipliers, time-in-trade limit, contracts) and, if desired, Profit Lock .
- Turn on Risk Controls if you want automated halting based on streaks or daily limits.
- Watch the top-left status label and the NinjaScript Output window to understand each day's behavior, and always test on Sim/replay before running live.
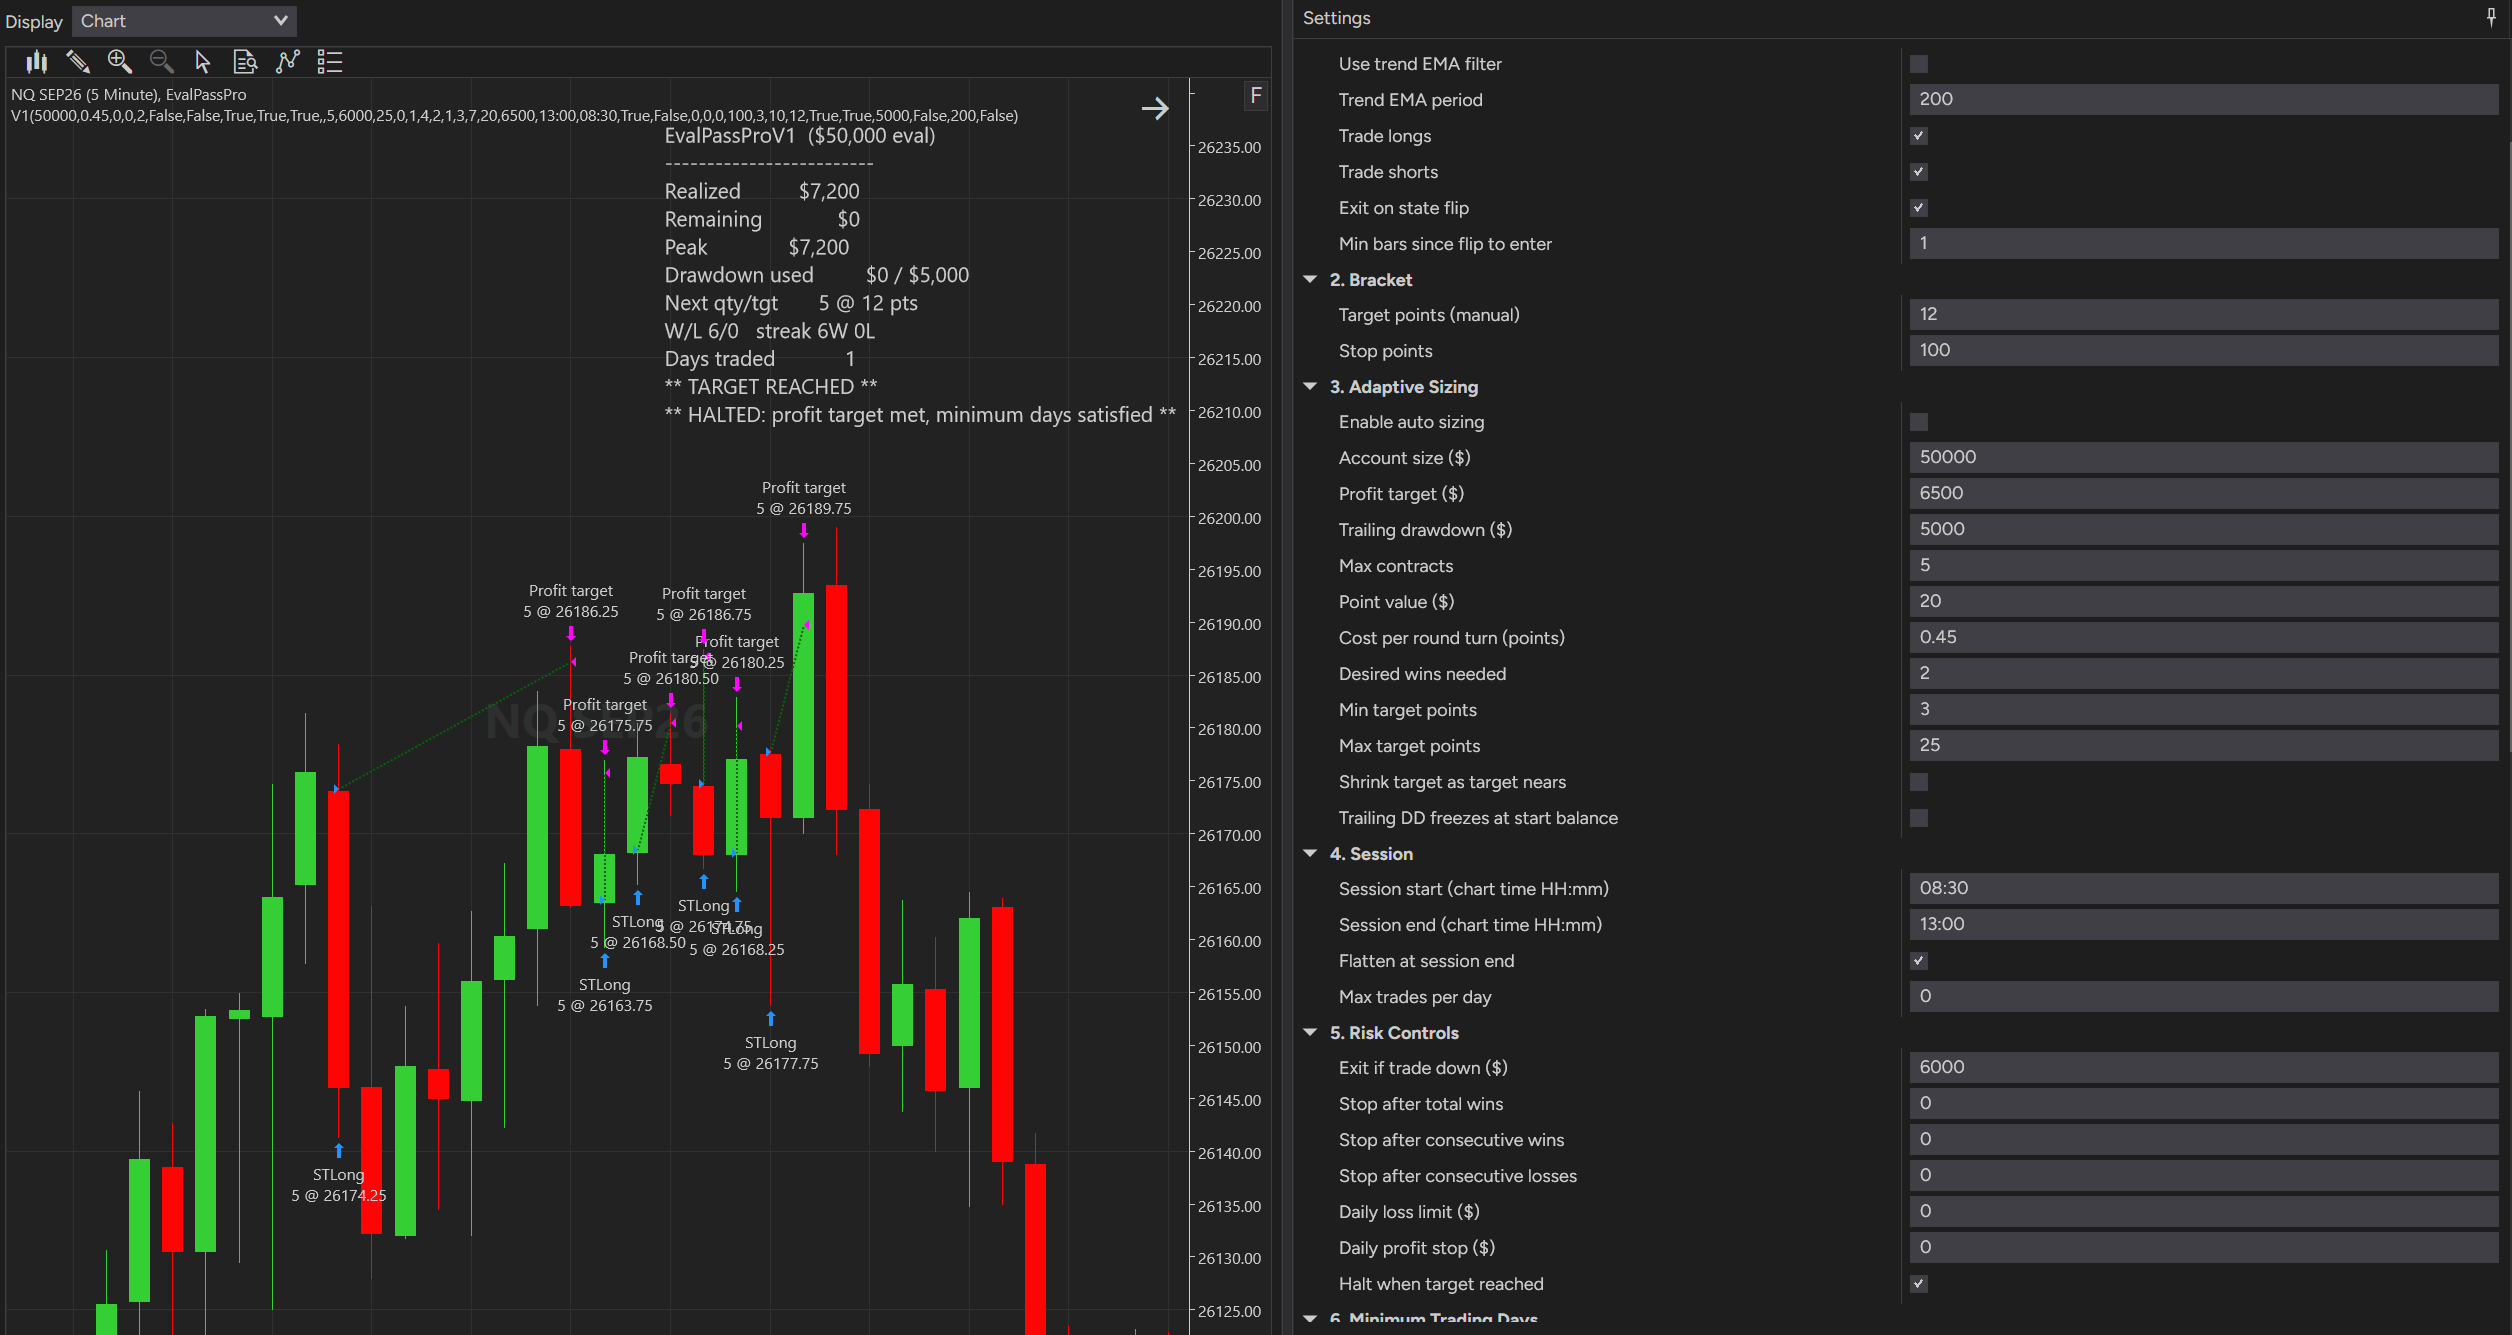
EvalPass Pro — User Guide
Type: NinjaTrader 8 Strategy (automated, places real orders) What it does: An automated strategy purpose-built to attempt to pass a futures prop-firm evaluation account. It trades a trend-based entry signal with an adaptive position-sizing and target system designed around a high win-rate approach, plus a full set of evaluation-specific risk controls (drawdown tracking, daily limits, minimum trading-day handling, and automatic halting).
This is not a general-purpose trading system and it is explicitly not intended for a funded/live account. It is designed around the specific mechanics of a prop-firm evaluation (a fixed profit target and a trailing/static drawdown limit that ends the evaluation if breached), not for long-term live trading performance.
Not financial advice. This guide explains how to install, configure, and monitor the strategy. It isn't a recommendation to use it, and nothing here is trading, investment, or financial advice — you're responsible for your own decisions, risk tolerance, and whatever capital or evaluation fees you commit.
Proprietary system — some internal mechanics are intentionally not documented here.
1. What Problem This Solves
Passing a prop-firm evaluation is a different problem than trading profitably long-term: you need to hit a fixed profit target without breaching a drawdown limit, often within a minimum number of trading days. EvalPass Pro is built specifically around that structure — favoring a high win-rate approach and adaptive sizing that responds to how close you are to the target, rather than a strategy optimized for open-ended live performance.
2. Critical Limitations — Read Before Using
These are disclosed directly by the strategy's own design notes and are important enough to repeat here in full:
- A firm-imposed daily loss limit can interfere with how this strategy is designed to work. Check your firm's specific rules before running it.
- Always verify your firm's contract size caps and minimum trading-day requirements independently — the strategy has settings to help address minimum days, but you are responsible for confirming your firm's actual rules.
- The probability of passing an evaluation with this approach is under 100%. You should expect that passing may take more than one attempt, and every attempt has a cost (typically an evaluation fee). Plan your budget accordingly.
4. How It Works (What's Shared, and What's Not)
Shared conceptually: - Entries are based on a trend-state signal — the strategy trades in the direction of the current trend state, with an option to skip the very first bar right after a state flip (since that bar has historically been a lower-quality entry). - An optional longer-term EMA filter can be layered on top to only take trades aligned with a broader trend direction. - Every position is protected by both a profit target and a stop-loss, in points. - Position size and the profit target distance can be either fixed (manual) or adaptive — when adaptive, the strategy recalculates both based on your evaluation's account size, profit target, remaining drawdown room, and how many winning trades you've told it you want the evaluation to require. - The strategy tracks running P&L, peak equity, win/loss streaks, and days traded, and can automatically halt itself when your evaluation's profit target is reached, when drawdown risk is breached, or when other configured limits are hit. - A "minimum trading days" mode can automatically switch to very small, low-risk position sizing once the profit target has already been reached, so you can continue satisfying a minimum-days requirement without meaningfully risking the account further.
5. Settings Reference
1. Signal
Trend multiplier
- Description: ATR multiplier used by the Supertrend calculation
Trend ATR period
- Description: ATR period used by the Supertrend calculation
Use trend EMA filter
- Description: Only take trades aligned with a longer-term EMA direction
Trend EMA period
- Description: Length of that longer-term EMA filter
Trade longs
- Description: Allow long entries
Trade shorts
- Description: Allow short entries
Exit on state flip
- Description: Exit an open position if the Supertrend state flips against it
Min bars since flip to enter
- Description: Skips entries on freshly-flipped bars;
1(recommended) skips the flip bar itself
2. Bracket
Target points (manual)
- Description: Fixed profit target in points, used only when auto-sizing is off
Stop points
- Description: Per-trade stop-loss distance in points. Intentionally wide by design — your account's drawdown rule is meant to be the real limiting stop
3. Adaptive Sizing
Enable auto sizing
- Description: Turns on adaptive position size and target calculation
Account size ($)
- Description: Your evaluation account's size
Profit target ($)
- Description: Your evaluation's dollar profit target
Trailing drawdown ($)
- Description: Your evaluation's trailing (or static) drawdown limit
Max contracts
- Description: Ceiling on position size regardless of other calculations
Point value ($)
- Description: Dollar value per point for your instrument (e.g. NQ=20, MNQ=2, ES=50, MES=5)
Cost per round turn (points)
- Description: Estimated commissions/fees, expressed in points, factored into sizing
Desired wins needed
- Description: How many winning trades you want the sizing to be built around needing to hit the target
Min target points
- Description: Floor on the calculated target distance
Max target points
- Description: Ceiling on the calculated target distance
Shrink target as target nears
- Description: Recalculates the target down as you get closer to your profit goal
Trailing DD freezes at start balance
- Description: Reflects the common prop-firm rule that trailing drawdown stops trailing once you're up by the drawdown amount
4. Session
Session start / end (chart time HH:mm)
- Description: Trading window
- Default:
08:30–13:00
Flatten at session end
- Description: Closes any open position at session end
- Default:
On
Max trades per day
- Description: Caps entries per day (
0= unlimited) - Default:
0
5. Risk Controls
Exit if trade down ($)
- Description: Hard intrabar cut on an open position's unrealized loss (
0= off)
Stop after total wins
- Description: Halts the strategy after this many total wins (
0= off)
Stop after consecutive wins
- Description: Halts after this many wins in a row (
0= off)
Stop after consecutive losses
- Description: Halts after this many losses in a row (
0= off)
Daily loss limit ($)
- Description: Stops trading for the rest of the day if hit (
0= off)
Daily profit stop ($)
- Description: Stops trading for the rest of the day if hit (
0= off)
Halt when target reached
- Description: Automatically halts once your profit target is reached (subject to minimum-days mode, below)
6. Minimum Trading Days
Enable minimum-days micro mode
- Description: Switches to small, low-risk trades to satisfy a minimum trading-days rule after your target is already reached
Minimum trading days
- Description: Number of days your firm requires you to have traded
Micro mode contracts
- Description: Position size used in micro mode
Micro mode target points
- Description: Profit target used in micro mode
Micro mode stop points
- Description: Stop-loss used in micro mode
7. Display
Show dashboard
- Description: Toggles the on-chart status panel
- Default:
On
6. Reading the Dashboard
The on-chart panel (top-right) shows: - Realized — your current realized P&L on the evaluation - Remaining — how much further you need to reach your profit target - Peak — your highest recorded equity, used for drawdown tracking - Drawdown used — how much of your trailing drawdown allowance has been used, out of the total - Next qty/target — the position size and target distance the strategy will use on its next entry - W/L and streak — total wins/losses and your current winning/losing streak - Days traded — how many distinct days you've placed at least one trade - Status banners — appear when your target has been reached, or when the strategy has halted (with the reason shown)
7. Suggested Starting Points
- Always confirm Account Size, Profit Target, and Trailing Drawdown exactly match your actual evaluation account's rules before running this live — these three settings drive the adaptive sizing.
- Set Point Value correctly for your instrument — this directly affects position sizing math (NQ=20, MNQ=2, ES=50, MES=5 are given as reference points in the settings description).
- Test on Sim/replay first. Confirm the dashboard numbers, halting behavior, and entries match your expectations before connecting to a real evaluation account.
- Review your firm's daily loss limit rules carefully and set Daily loss limit ($) accordingly if your firm enforces one — this is explicitly flagged as something that can interfere with the strategy's core approach if left unset.
8. Troubleshooting
Strategy never enters a trade
- Likely Cause: Outside your configured session window, Max trades per day reached, or the strategy has halted
- Fix: Check the dashboard's status banner for a halt reason; confirm current time is within Session start/end .
Strategy stopped trading mid-day and won't resume
- Likely Cause: A daily halt condition (daily loss limit or daily profit stop) was triggered
- Fix: This resets automatically the next trading day; check the dashboard for which daily limit was hit.
Strategy stopped entirely and won't resume at all
- Likely Cause: A permanent halt condition was triggered (drawdown breach, win/loss streak cap, total win cap, or target-reached with minimum days satisfied)
- Fix: Check the dashboard's "HALTED" banner for the specific reason; a full halt requires removing and re-adding the strategy (or otherwise resetting it) to resume.
Position sizes or targets look unexpected
- Likely Cause: Point Value may not match your instrument, or one of Account Size/Profit Target/Trailing Drawdown doesn't match your real evaluation account
- Fix: Double-check all four settings against your actual account details.
Micro mode isn't activating after target is reached
- Likely Cause: Enable minimum-days micro mode is off, or Days traded has already met Minimum trading days
- Fix: Confirm the toggle is on; micro mode is only meant to activate when more trading days are still needed after the target is met.
Dashboard doesn't appear
- Likely Cause: Show dashboard is off
- Fix: Enable it in the Display group.
Quick Start Summary
- Add the strategy to your chart (named EvalPass Pro ).
- Set Account Size , Profit Target ($) , Trailing Drawdown ($) , and Point Value ($) to exactly match your evaluation account.
- Set your trading Session start/end and review the Risk Controls group against your firm's specific rules, especially any daily loss limit.
- Test thoroughly on Sim/replay before connecting to a real evaluation account.
- Monitor the on-chart dashboard for realized P&L, drawdown usage, and halt status.
- Remember: this is designed specifically for evaluation mechanics, is not a guaranteed-pass system, and is not intended for funded/live account trading.
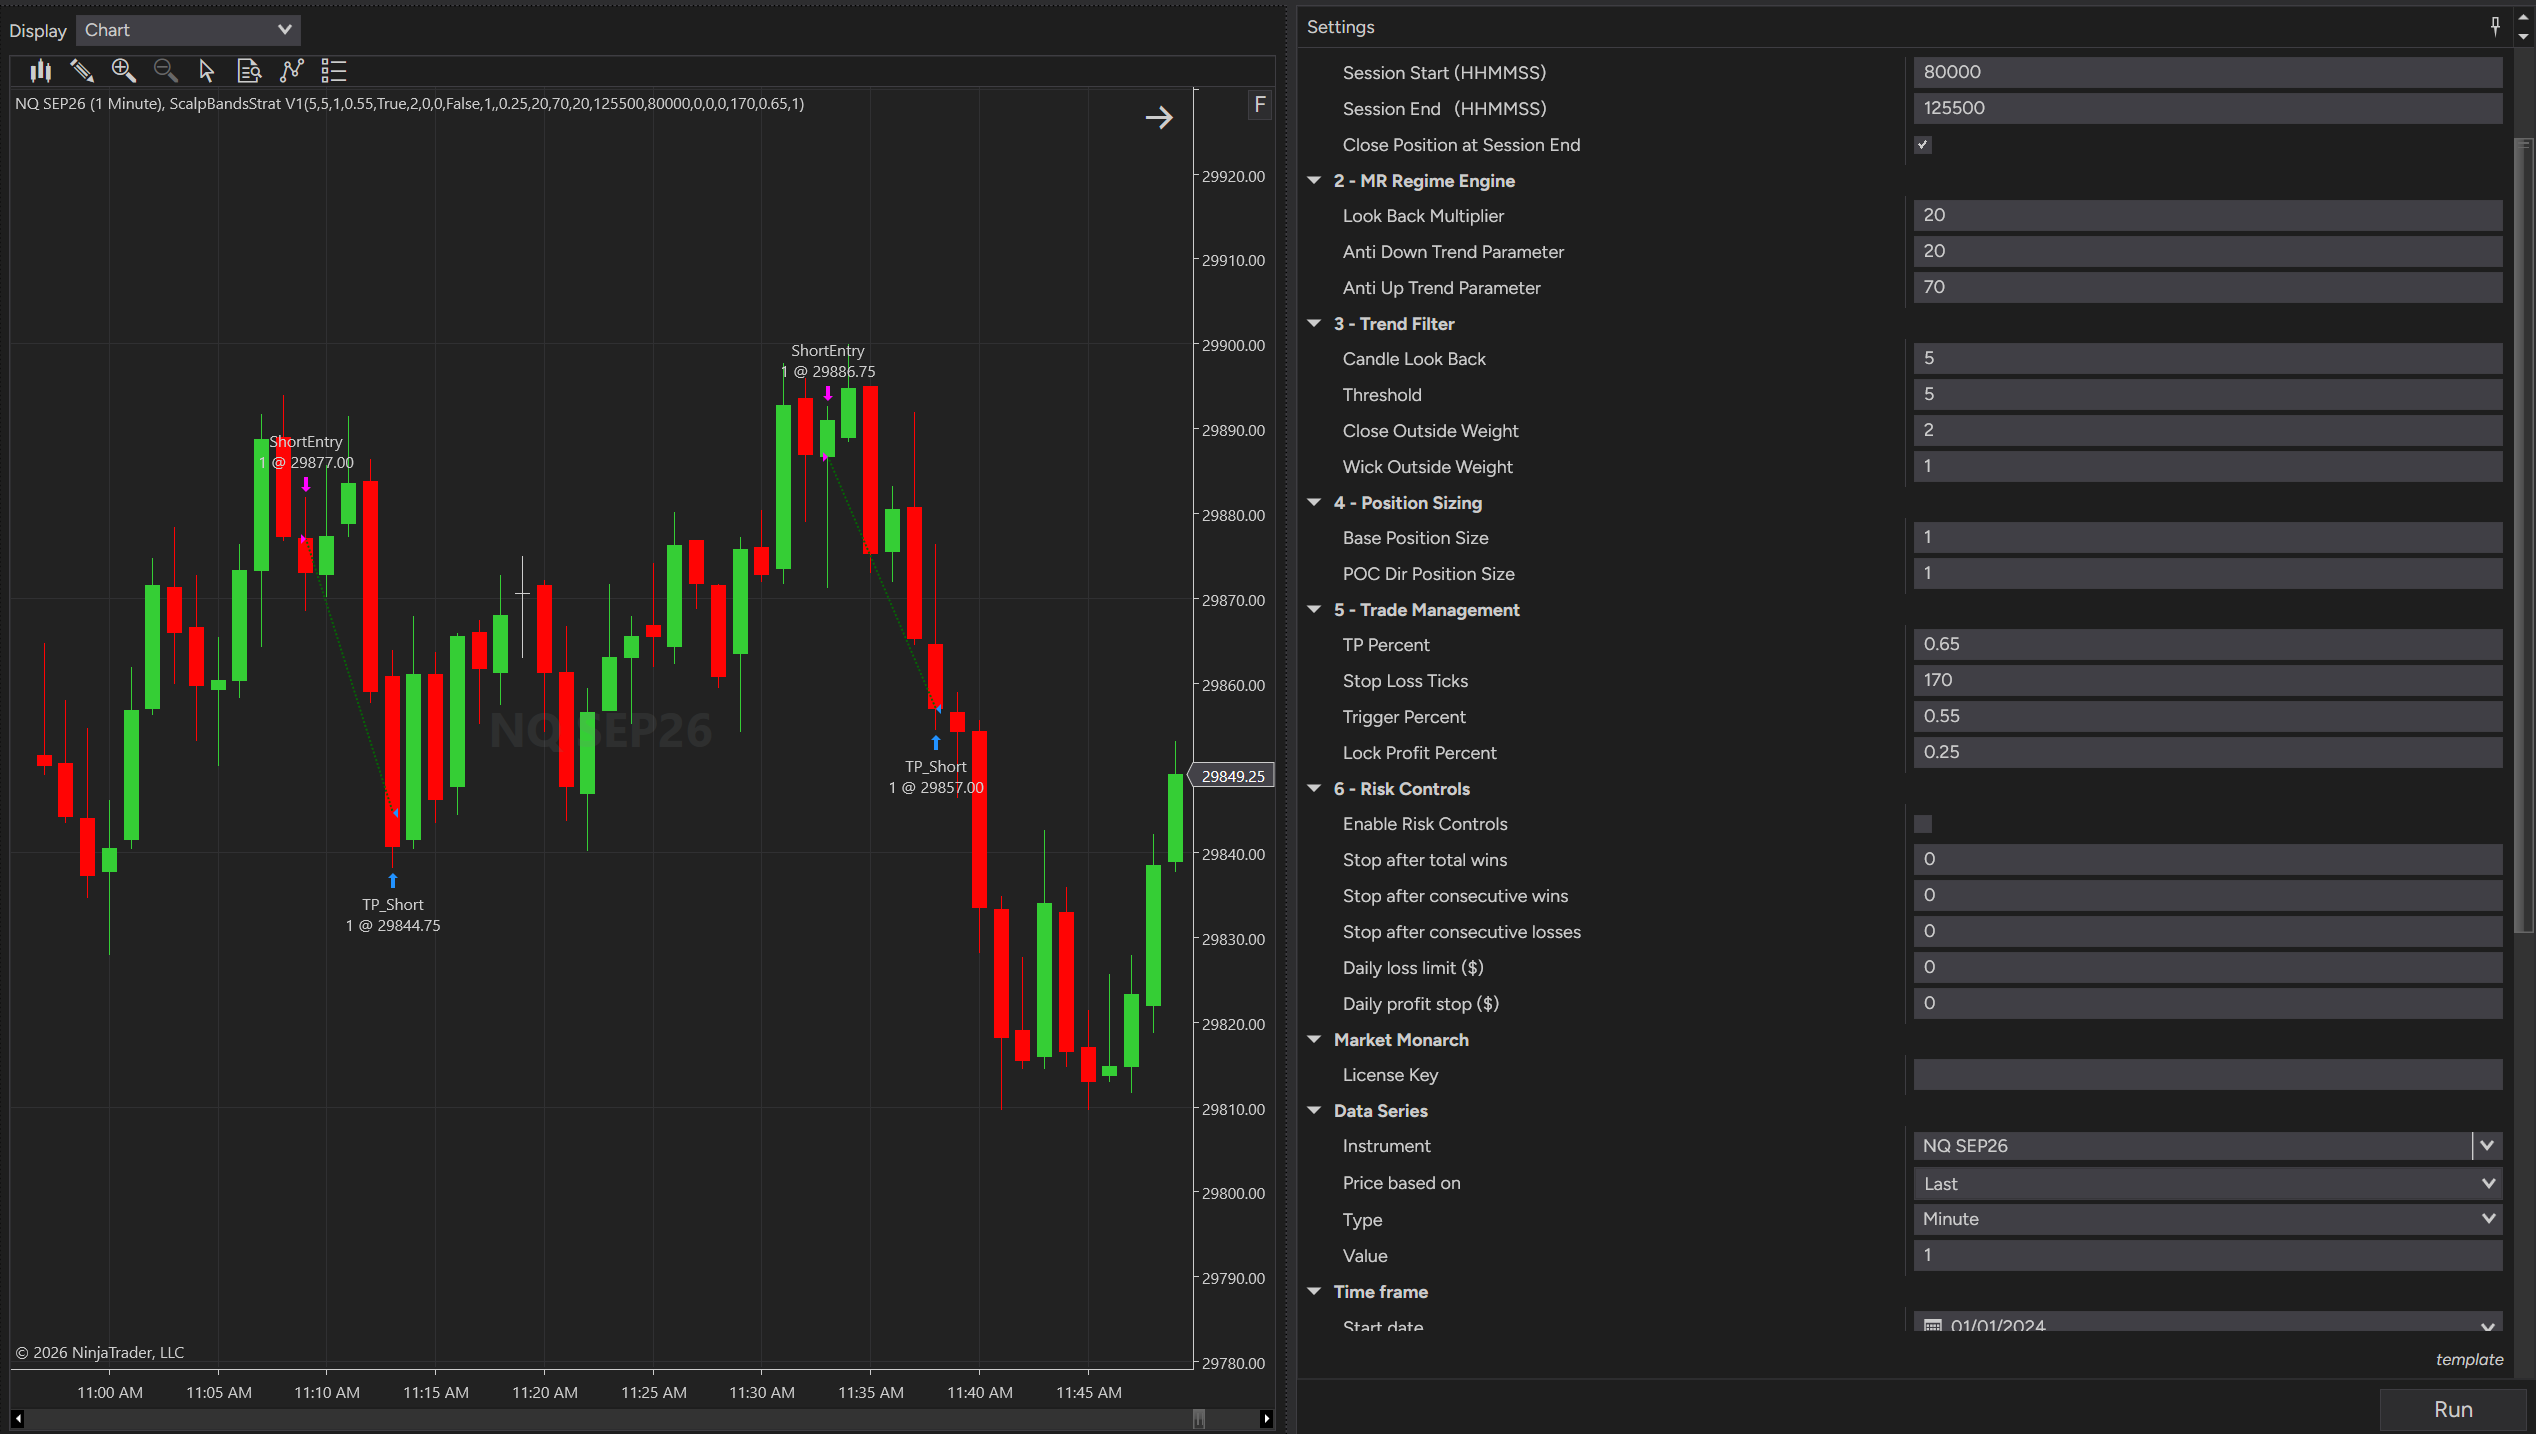
Scalp Bands Strategy — User Guide
Type: NinjaTrader 8 Strategy (automated, places real orders) Primary chart: 1-minute bars What it does: The automated trading counterpart to the Scalp Bands indicator. Trades Bollinger Band mean-reversion rejections, filtered by a "band walk" suppression check and an RSI-based chop-zone regime filter, with volume-profile-based position sizing, a percentage-based take-profit/stop-loss bracket, an optional profit lock, and a full opt-in risk-control section.
Not financial advice. This guide covers installation, configuration, and monitoring. It isn't a recommendation to trade this strategy live, and nothing here is trading or investment advice — you're responsible for your own testing, risk tolerance, and capital.
1. What Problem This Solves
A basic "price touched the Bollinger Band" reversal signal fires constantly and is often wrong, especially when the market is trending strongly rather than ranging (a "band walk"). Scalp Bands Strategy only takes a rejection trade when: the market hasn't been walking the band recently, RSI suggests conditions are choppy rather than strongly trending, and the trade's target is set intelligently based on how strong the current trend reading is. Position size is also automatically adjusted based on whether the trade lines up with the session's Point of Control (POC).
3. How It Works (Plain English)
- Session filter: Trading only occurs between your configured Session Start/End times. Outside that window, the strategy takes no new trades, and can optionally flatten any open position.
- Rolling session Point of Control (POC): The strategy continuously tracks which price level has traded the most volume so far in the session — this feeds into position sizing (see below).
- Band Walk Filter: Before any entry is considered, the strategy scores recent bars for how much price has been closing or wicking outside the Bollinger Bands. If that score is too high, the market is judged to be "walking" the band (trending, not ranging), and no new entry is taken — a band-walk situation is the opposite of what a mean-reversion trade wants to see.
- MR Regime Engine (RSI filter): Requires RSI to sit inside a configurable "chop zone" between a lower and upper bound before allowing any entry — meant to avoid taking reversion trades during a strong directional move.
- Entry signal:
- Short: the bar opened above the upper Bollinger Band and closed back inside it, on a red (bearish) bar — a rejection of the upper band.
- Long: the bar opened below the lower Bollinger Band and closed back inside it, on a green (bullish) bar — a rejection of the lower band.
- Target band selection: The target isn't just "the middle band" — it's chosen based on the current trend-strength (ADX) reading: weaker trend strength targets the far band, moderate strength targets the middle band.
- Position sizing: If the entry price is on the "expected" side of the session's rolling POC for that direction, the strategy uses your POC Dir Position Size instead of the default Base Position Size — effectively sizing up when the trade lines up with where the session's volume has concentrated.
- Trade management: A percentage-based take-profit and a fixed tick stop-loss are placed immediately on fill. An optional one-time Profit Lock can move the stop to a partial profit level once price has moved far enough toward target.
- Risk Controls (optional): Can automatically halt new entries — permanently for the run, or just for the rest of the day — based on win/loss streaks, total wins, or daily dollar P&L. A halt only blocks new entries; it never force-closes an open position — the trade's native take-profit, stop-loss, and profit lock continue to manage it.
4. Fixed (Non-Adjustable) Parameters
A few core values are locked internally and are not exposed as settings, by design: - Bollinger Band Period: 20 - Bollinger Band Std Dev: 2.0 - ADX Period: 14 - Low ADX Threshold: 15 (below this, target = far band) - Mid ADX Threshold: 25 (between Low and Mid, target = middle band)
5. Settings Reference
1. Session Filter
Session Start (HHMMSS)
- Description: Start of the trading window, 24-hour format
- Default:
80000(8:00:00 AM)
Session End (HHMMSS)
- Description: End of the trading window
- Default:
125500(12:55:00 PM)
Close Position at Session End
- Description: Flattens any open position when the session window ends
- Default:
On
2. MR Regime Engine
Look Back Multiplier
- Description: RegimeR period
Anti Down Trend Parameter
- Description: Lower bound of the chop zone
Anti Up Trend Parameter
- Description: Upper bound of the chop zone
3. Trend Filter (Band Walk)
Candle Look Back
- Description: How many recent bars to score for band-walking behavior
Threshold
- Description: Score above which a new entry is blocked (market judged to be walking the band)
Close Outside Weight
- Description: Points added per bar where the close was outside the band
Wick Outside Weight
- Description: Points added per bar where only a wick poked outside the band
4. Position Sizing
Base Position Size
- Description: Default position size when the trade is not on the POC-favored side
POC Dir Position Size
- Description: Position size used when the trade is on the POC-favored side
5. Trade Management
TP Percent
- Description: How far (as a % of the distance to the target band) the take-profit is placed
Stop Loss Ticks
- Description: Fixed stop-loss distance, in ticks
Trigger Percent
- Description: % of the way to the take-profit price that must be covered before the profit lock fires
Lock Profit Percent
- Description: % of the way to the take-profit price the stop moves to once the profit lock fires
6. Risk Controls
Enable Risk Controls
- Description: Master switch — while off, nothing else in this section does anything
Stop after total wins
- Description: Permanently halts the run after this many total wins (
0= off)
Stop after consecutive wins
- Description: Permanently halts after this many wins in a row (
0= off)
Stop after consecutive losses
- Description: Permanently halts after this many losses in a row (
0= off)
Daily loss limit ($)
- Description: Halts for the rest of the day if hit; resets next day (
0= off)
Daily profit stop ($)
- Description: Halts for the rest of the day if hit; resets next day (
0= off)
6. Reading the Strategy's Behavior
- No entry during an obvious band touch — likely blocked by the Band Walk Filter (market judged to be trending, not ranging) or the RSI chop-zone filter (RSI outside the configured band).
- Position size larger than your Base Position Size — the entry lined up with the POC-favored side, so POC Dir Position Size was used instead.
- Stop moved partway through a winning trade — the Profit Lock triggered, moving the stop to a partial-profit level.
- No new entries at all for a stretch — check whether Enable Risk Controls is on and a halt condition (permanent or daily) has been triggered.
- Position flattened right at session end — expected if Close Position at Session End is on and the session window closed with a position still open.
7. Suggested Starting Points
- Run on the 1-minute timeframe this strategy was built and tuned for; other timeframes are untested by design (the core Bollinger/ADX parameters are locked, not auto-scaled).
- Test the Band Walk Filter and RSI filter individually by adjusting their thresholds to see how much they reduce entry frequency versus the base signal.
- Position sizing: if you don't want size to vary based on POC alignment, set Base Position Size and POC Dir Position Size to the same value.
- Profit Lock tuning: raise Trigger Percent for a later, more conservative lock; lower it to lock in profit sooner at the cost of potentially leaving more on the table.
- Always test on Sim/replay first and review a range of session days before running live, since band-walk and chop-zone conditions can vary significantly by day.
8. Troubleshooting
No trades at all
- Likely Cause: Outside the Session Start/End window, Risk Controls has halted the strategy, or conditions haven't produced a qualifying rejection bar
- Fix: Confirm current time is within session hours; check for a halt if Risk Controls is enabled.
Entries seem to skip obvious band touches
- Likely Cause: Band Walk Filter or RSI chop-zone filter is blocking them
- Fix: Temporarily loosen Threshold (Band Walk) or widen the RSI chop zone ( Anti Down/Up Trend Parameter ) to see if entries resume.
Position sizes vary between trades
- Likely Cause: This is expected — size depends on whether the entry is on the POC-favored side
- Fix: Set Base Position Size equal to POC Dir Position Size if you want consistent sizing.
Stop moved mid-trade unexpectedly
- Likely Cause: Profit Lock fired once price crossed the Trigger Percent threshold
- Fix: This is expected, one-time behavior — check Trigger Percent / Lock Profit Percent if the timing feels off.
Strategy halted and won't resume
- Likely Cause: A permanent halt condition fired under Risk Controls (total wins, win streak, or loss streak cap)
- Fix: This requires removing and re-adding the strategy (or otherwise resetting it) to resume, by design.
Strategy stopped for the day but resumed the next day
- Likely Cause: A daily-only halt (Daily loss limit or Daily profit stop) was hit — resets automatically each day
- Fix: This is expected behavior.
Quick Start Summary
- Add the strategy to a 1-minute chart (named ScalpBandsStrat in the strategy list; nicknamed Scalp Bands Strategy ).
- Set Session Start/End to match your intended trading hours.
- Leave the Band Walk and RSI chop-zone filters at their defaults initially, and observe entry frequency and quality.
- Configure Trade Management (TP Percent, Stop Loss Ticks, Profit Lock) to match your risk/reward preferences.
- Set Base Position Size and POC Dir Position Size based on how much you want position size to vary with POC alignment.
- Turn on Risk Controls if you want automated halting based on streaks or daily P&L limits — remember a halt only blocks new entries, never force-closes an open trade.
- Always test thoroughly on Sim/replay before running live.
Algorithmic Trading: Foundational Knowledge Points
1. Every Algorithm Type Has a "Home" Market Condition
No algorithm works everywhere, all the time. The core families:
- Trend-following / momentum (moving average crossovers, breakout systems, momentum indicators): thrives in sustained directional moves. Struggles badly in choppy, range-bound markets — you get whipsawed, entering trends that immediately reverse.
- Mean-reversion (RSI extremes, Bollinger Band fades, statistical arbitrage): thrives in range-bound, low-trend, high-noise conditions. Gets destroyed in strong trends — you keep fading a move that never reverts.
- Breakout systems: need volatility contraction followed by expansion (e.g., low-volatility squeeze before a move). Perform poorly in "false breakout" markets with lots of fakeouts.
- Market-making / scalping: need liquidity and tight, stable spreads, and tend to break down in high-volatility or thin/illiquid conditions where spreads widen and adverse selection increases.
- Carry / seasonality strategies: depend on structural conditions (interest rate differentials, seasonal supply-demand patterns) that can persist for years then disappear.
Takeaway: before deploying a strategy, know what regime it's built for, and have some way (even a simple volatility or trend-strength filter) to recognize when that regime is present or absent.
2. Market Conditions Are Not Static — Yesterday's Edge Can Decay
A strategy with parameter set A that worked well in 2025 is not guaranteed to work with the same parameters in 2026. Reasons this happens:
- Volatility regime shifts — average daily range, ATR, and implied volatility change over time (e.g., a low-vol grind market vs. a high-vol news-driven market).
- Liquidity and participant changes — more/fewer algos competing for the same edge, changes in retail vs. institutional flow, new market structure (e.g., 0DTE options flow changing index behavior).
- Macro regime changes — rate cycles, inflation regimes, central bank policy shifts alter correlations and typical price behavior.
- Structural/seasonal changes — a commodity's supply chain, a company's business model, or an index's sector composition can shift.
- Alpha decay from crowding — if enough participants find and trade the same edge, it gets arbitraged away or reduced.
Practical implication: parameters aren't "set and forget." They need periodic review, and often need to be re-optimized or re-fit to current conditions — not necessarily because the underlying logic is wrong, but because the market's statistical properties (volatility, mean reversion speed, trend persistence) have moved.
A common practice to manage this is walk-forward testing: repeatedly optimize on a trailing window of data, then test on the next unseen period, rolling forward through time. This simulates how a strategy would have needed to adapt in real time, rather than fitting one static parameter set to years of history at once (which risks overfitting).
3. Parameter Changes (Take Profit / Stop Loss) Reshape the Return Distribution, Not Just the P&L
Adjusting TP/SL doesn't just make you "more or less profitable" — it changes the shape of your results:
- Tighter stop-loss → typically lower win rate (you get stopped out by normal noise more often) but smaller average loss size.
- Wider stop-loss → typically higher win rate (more room for a trade to work out) but larger average loss size when it does lose.
- Closer take-profit → typically higher win rate, smaller average win size (you bank profits before the full move plays out).
- Farther take-profit → typically lower win rate (price often doesn't reach the target), but larger average win size on trades that do hit.
This is why win rate alone is a misleading metric. A strategy with a 30% win rate can be very profitable if average win size is several multiples of average loss size. A strategy with a 70% win rate can lose money if average losses are large relative to average wins.
The key relationship is expectancy:
Expectancy = (Win Rate × Avg Win) − (Loss Rate × Avg Loss)
Changing TP/SL moves win rate and avg win/loss in opposite directions — so the real question is whether a given adjustment improves expectancy (and other factors like drawdown and trade frequency), not whether it improves win rate in isolation. It's common to grid-search or walk-forward test TP/SL combinations rather than assume "tighter stop = safer" or "higher win rate = better."
Other second-order effects worth tracking when you adjust TP/SL:
- Trade frequency (tighter TP = faster turnover, more trades, more transaction costs)
- Max drawdown (wider stops = bigger single-trade drawdowns)
- Risk-adjusted return (Sharpe/Sortino), not just raw P&L
4. Generalizing One Algorithm Across Timeframes / Markets Requires Parameter Adaptation
A single algorithmic logic (e.g., "buy when price breaks above the N-period high") can often be applied across multiple timeframes or instruments, but the parameters usually cannot be copy-pasted — each market/timeframe has different statistical characteristics:
- Volatility scale differs — a 20-pip stop on a low-volatility forex pair is very different from a 20-pip stop on a high-volatility one. Many practitioners normalize risk parameters using ATR (Average True Range) or historical volatility rather than fixed point/tick values, so the same logical strategy adapts its stop/target distance to each instrument's typical movement.
- Timeframe changes noise vs. signal ratio — a lookback period of "14" on a 5-minute chart behaves very differently than "14" on a daily chart in terms of how much noise vs. real structure it captures. Parameters (lookback lengths, smoothing periods) often need to scale with timeframe.
- Liquidity/tick size/session structure differ by market — commodities, forex, and equities each have different trading hours, typical spread costs, and tick sizes, which affect minimum viable stop distances and slippage assumptions.
- Correlation and behavior differ — e.g., a mean-reversion strategy tuned for a range-bound commodity may need very different parameters (or may not work at all) on a trending currency pair.
Practical approach: treat the rules/logic as portable, but re-optimize or re-scale the parameters (stop distance, lookback length, thresholds) per market and per timeframe — often using volatility-normalized units instead of fixed values so the strategy adapts automatically.
5. Related Concepts Worth Knowing Early
- Overfitting / curve-fitting: optimizing parameters too precisely to historical data so they capture noise rather than a real, repeatable edge. A strategy that looks great on a backtest but has many finely-tuned parameters is a red flag.
- In-sample vs. out-of-sample testing: optimize on one data period, validate on a separate period the parameters weren't fit to.
- Transaction costs and slippage: backtests that ignore spread, commissions, and slippage often look far more profitable than live results will be — especially for higher-frequency strategies.
- Regime filters: some traders add a simple filter (e.g., a trend-strength or volatility measure) to turn a strategy on/off depending on whether current conditions match what it was designed for, rather than running it blindly at all times.
- Position sizing / risk per trade: independent of TP/SL choice, how much capital is risked per trade has a large effect on drawdown and long-run compounding, and is often a separate lever from the entry/exit logic itself.
These are general educational concepts, not investment advice or a recommendation to trade any specific way. Backtested and historical performance doesn't guarantee future results.